

Trading strategies are the trading plans to execute trades properly. Without a trading plan, it is more like gambling in the FX market. You may be profitable for a shorter period, but you can’t make constant profits from the marketplace without proper trading plans. There is no alternative to having a beneficial forex trading method that suits your trading psychology.
However, choosing the best strategy for trading depends on several factors such as capital size, investment types, participants types, etc. This article will introduce the best strategy for FX trading.
Moreover, we describe the best three methods among them so you will know how to make constant profits.
What is the best trading strategy?
In the global financial market, participants such as banks, small and large financial institutes, firms, and individuals use different trading plans to execute trades depending on capital, time duration, etc.
Several micro-, macro-, socioeconomic, and political factors affect currency prices. So no trading strategy gives a hundred percent guarantee of forever profitability. Therefore, if you think that the best FX strategy for consistent profit will make you rich overnight, you are wrong.
Instead, the best FX strategies provide more significant outputs and more winning trades than average trading strategies. It is a more manageable and complete system.
Some popular strategies are:
- Double top and bottom
- MACD based system
- Bollinger bands breakout and riding
- Gimme bars system
- Support resistance strategy (S&R)
- Trend following strategy
- FX reversal strategy
Now let’s describe the best three strategies.
Moving average convergence and divergence strategy
MACD is a prevalent tool among professional traders. It is also a common tool for automated systems or robot trading. In this method, we will use a top to down approach to seeking potentially trading positions.
Bullish trade setup
The MACD indicator has two lines:
- Blue
- Red
When the blue line crosses above the red line, it indicates a bullish scenario. For confirmation, check the histogram bars. When histogram bars start to appear above the middle line of the MACD window, you can place buy orders.
- Place buy orders when the crossover happens, and histogram bars move above the central line.
- Initial stop loss will be below the recent swing low.
- You can continue to place buy orders on that currency pair until the opposite crossover happens on the signal lines.
- Close buy positions when the blue signal line touches the red signal line.
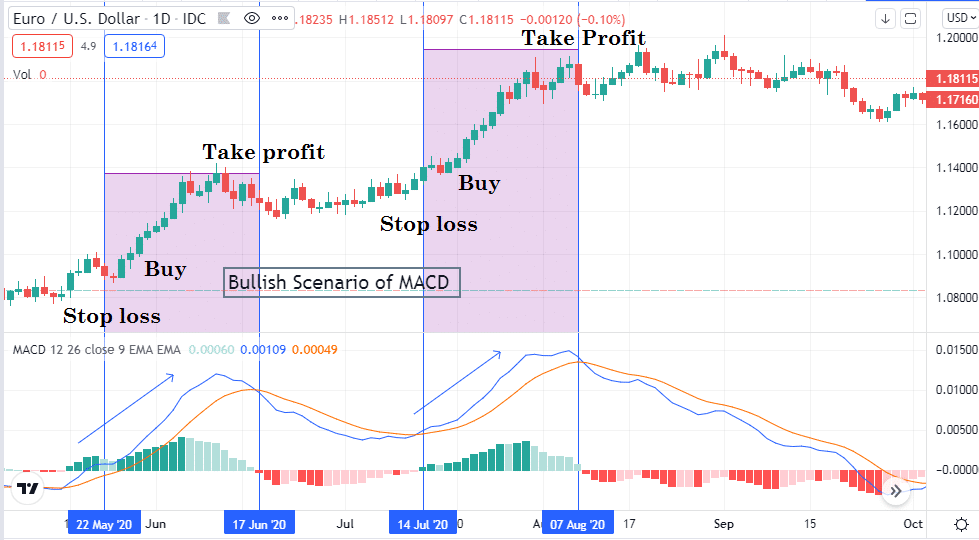
Bullish MACD setup
The figure above shows MACD’s bullish setup on a daily chart of EUR/USD. Using this strategy, you can make thousands of green pips monthly from the bullish price movement of currency pairs. This strategy works fine on lower time frames such as 4-hours or 1-hour time frame charts.
Bearish trade setup
A bearish trade setup is just the opposite of a bullish trade setup. When the blue line crosses below the red line, it indicates seller domination on the asset price.
- For confirmation, check on the histogram bars.
- Place sell orders after the bearish crossover, and histogram bars appear below the central line.
- Continue the sell orders till the opposite crossover occurs between the signal lines.
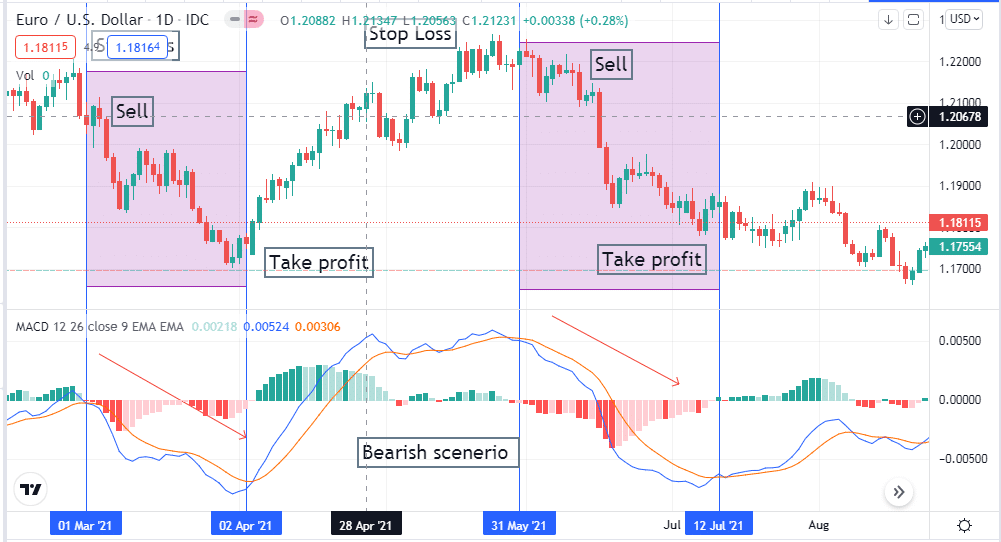
Bearish MACD setup
The figure above shows the MACD bearish setup on a daily chart of EUR/USD. You can make trades and ride on the trend, making constant profitable trading positions using this strategy.
Bollinger bands: forex strategy for consistent profits
BB trading strategy is common among financial traders. The price movement shows different phases, such as accumulation distribution phases. When the bands of the BB get closer, it indicates less volatility, and a possible breakout is coming.
Bullish trade setup
When the bands are closer and price candles touch the lower band, a bullish movement is possibly near.
- Wait until the price reaches the middle band.
- Place buy orders when price crosses above the middle band after closing of a bullish candle.
- Hold buy positions till price touches at the upper band.
- Put an initial stop loss below the middle band.
- As the bearish candles form and get closer to the middle band, close the buy positions.
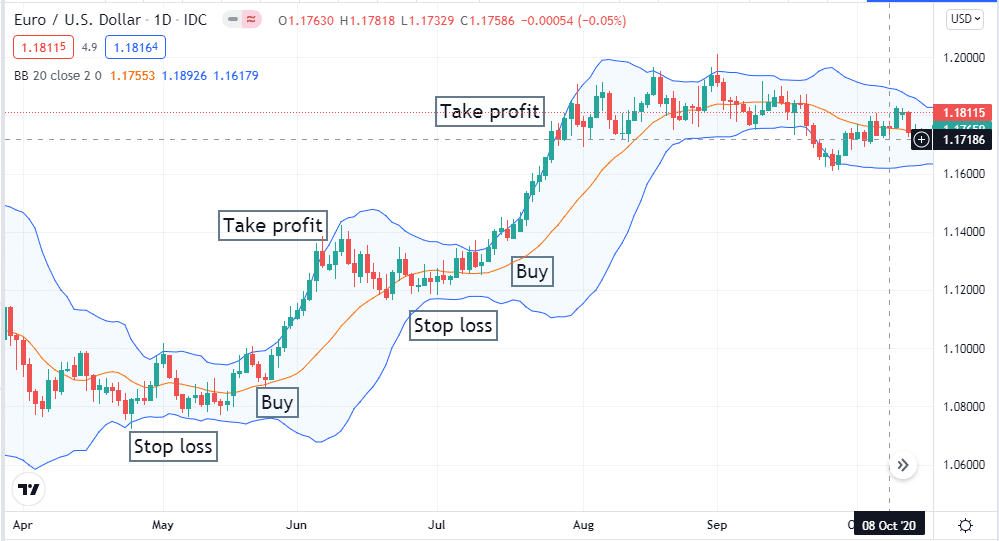
Bullish BB setup
The figure above shows a bullish trade setup using BB at the daily chart of EUR/USD.
Bearish trade setup
Price starts to fall after touching the upper band is a bearish indication.
- Place sell orders when the price crosses below the middle band.
- Put an initial stop loss above the middle band.
- Continue to sell positions until price rejects from the lower band and start to come closer to the middle band.
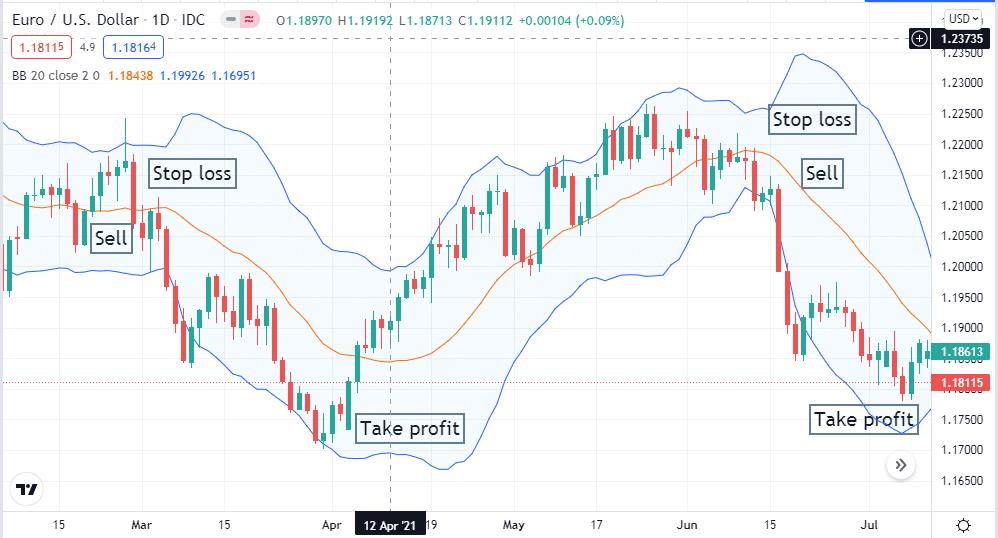
Bearish BB setup
The figure above shows the bearish trade setup using BB on a daily chart of EUR/USD. You can make constant profitable trading positions by using this strategy.
Support and resistance: forex strategy for consistent profits
Using S/R levels to find trade setup is a prevalent practice among financial traders. These are the levels where the price usually bounces back or takes breaks before continuing. Several price action, historical, technical, and fundamental levels act as S&R levels in the FX market. Two types of S&R levels are: static and dynamic.
- Static levels are fixed static levels.
- Dynamic levels act as both S&R levels.
Bullish trade setup
Identify the important price areas or levels around the price.
- Place buy orders when the price starts to bounce back from the support levels or a breakout happens.
- If the price breaks the resistance level and continues toward the upside, that is also an excellent scenario to place buy orders.
- Place an initial stop loss below the support level.
- You can shift your stop loss at the breakeven or above it as a part of risk management after the price makes a higher high.
- Take profit will be below the recent resistance level.
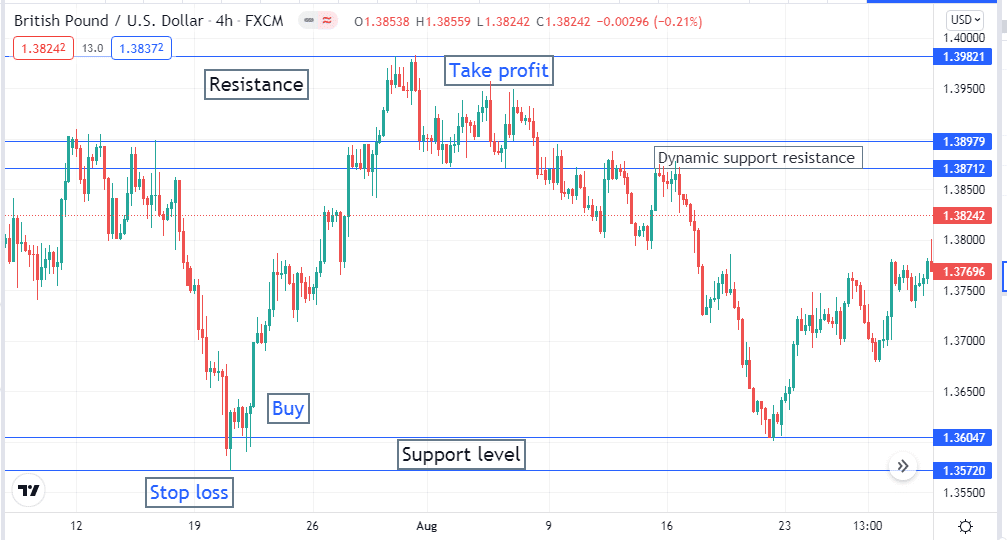
Bullish S&R setup
The figure above shows a bullish trade setup on a 4-hour chart of GBP/USD by using support resistance.
Bearish trade setup
- Identify the support resistance levels.
- Place sell orders when the price reaches the resistance or breakout happens at the downside.
- Place an initial stop loss above the resistance level.
- Take profit will be above the recent support level.
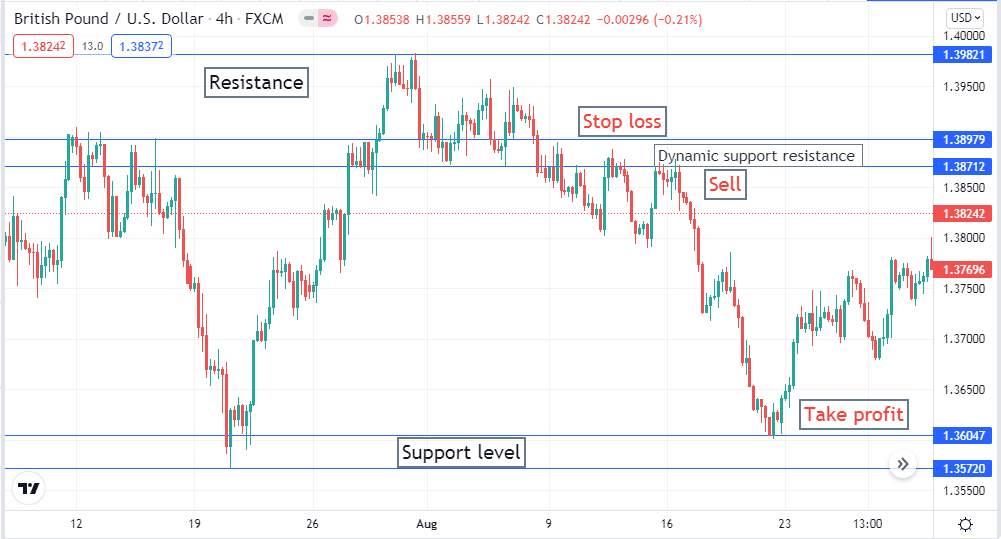
Bearish support resistance setup
The figure above shows a bearish trade setup on a 4-hour chart of GBP/USD by using the support resistance method.
Final thoughts
These best strategies above may seem so simple to understand. It requires a certain level of practice and experience to master these strategies. We suggest practicing these strategies on a demo chart and observe the results. If the results are satisfying and suitable with your trading style, then apply the actual trading.


Comments