

The video game industry is massive and overgrowing. Around 2.7 billion people around the world enjoy gaming. This number has increased during the Covid-19 pandemic as more people sharply boosted their use of video games while sheltering at home. This number is expected to grow to 3 billion by 2023, with the market projected to exceed $200 billion.
Whether you’re into gaming or not, it would be foolish to ignore the fact that it’s a burgeoning multibillion-dollar industry, primed to continue accelerating with the advent of things like cloud computing, virtual reality, smartphones, and tablets.
What are video game ETFs?
Gaming ETFs initially focused on casino and gambling companies, but they increasingly have broadened their scope to own stocks of companies involved in video games and eSports. While some ETFs hold shares of companies in both the video gaming and gambling industries, below, we focus on funds explicitly dedicated to companies in the video game industry.
Thus, the video game ETF is the fund designed to provide exposure to companies that develop or publish video games, facilitate content streaming and distribution, own and operate within competitive eSports leagues, or produce hardware for video games and eSports.
How to buy video game ETFs?
The buying and selling of such shares are the same as for stock shares, placing orders through your brokerage account.
Step 1. Purchase shares by placing a buy order with several shares.
Step 2. Wait until your order will be filled almost immediately during market hours.
Step 3. Confirm that the order was filled by checking your account summary page.
Top five video game ETFs to buy
Here’s an overview of the top five exchange-traded funds that offer a convenient way to participate in the growth trajectory of this segment.
№ 1. Global X Video Games & Esports ETF (HERO)
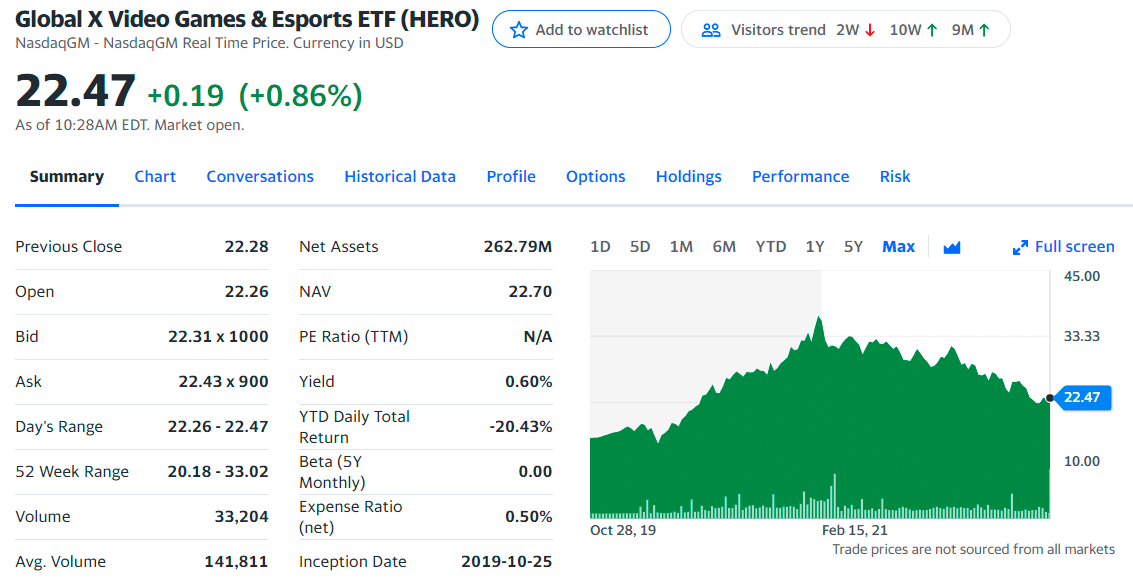
HERO ETF summary
It was launched in 2019 and managed by Chang Kim since October 25, 2019, at Global X Funds.
HERO is an ETF that tracks the performance of the Solactive Video Games & Esports Index. This index tracks the performance of companies positioned to benefit from increased consumption related to video games and eSports.
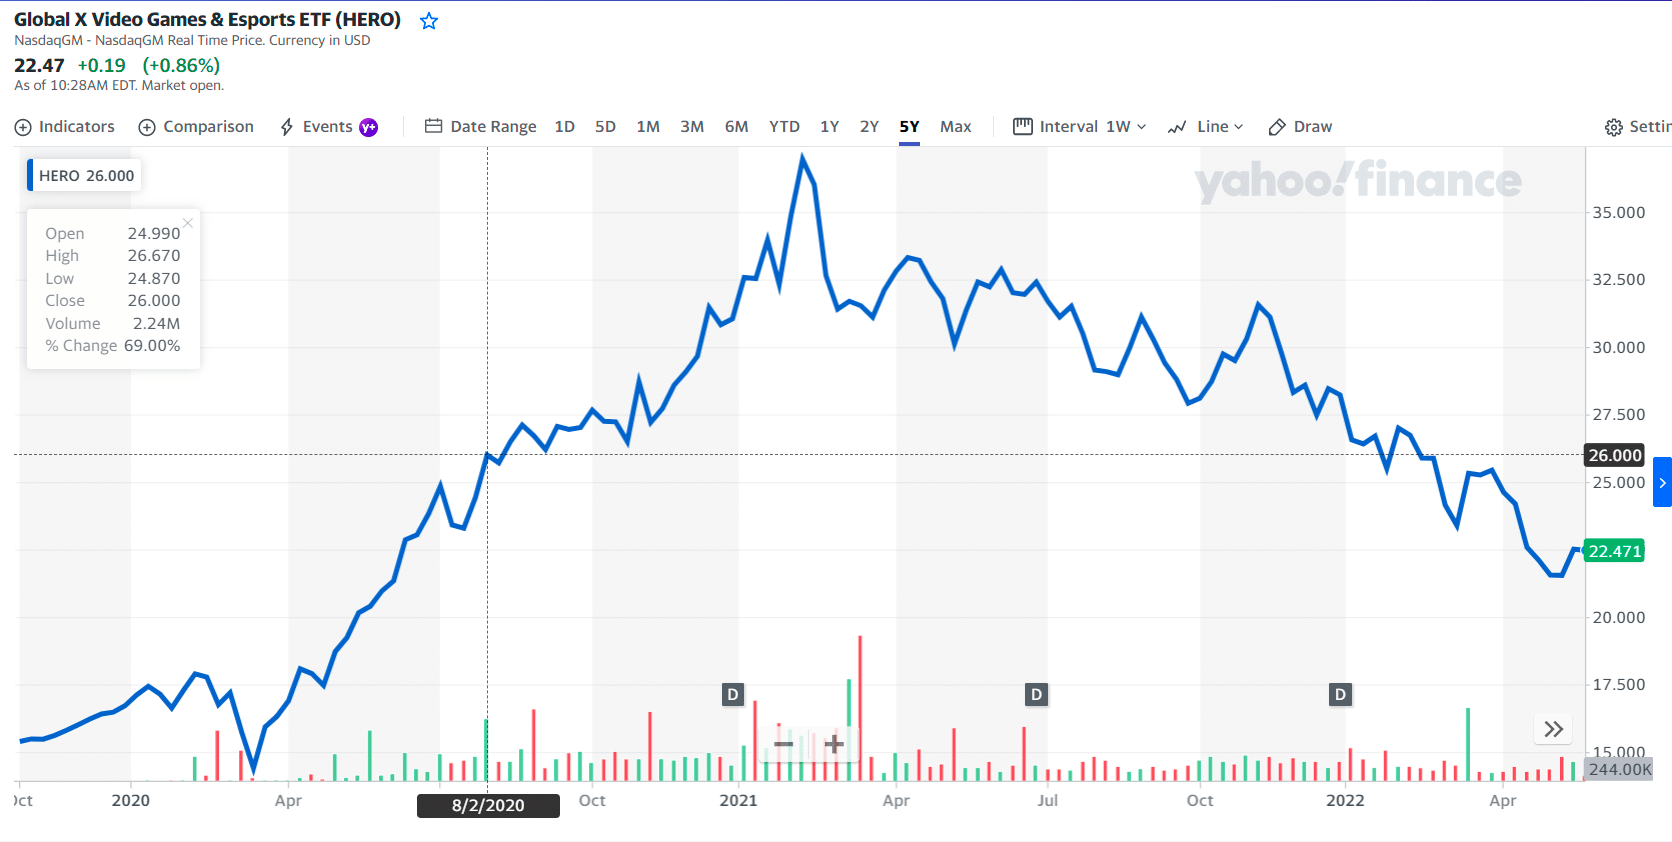
HERO price chart
HERO has an expense ratio of 0.50%, 11% lower than its category. Its expense ratio is average compared to funds in the Technology category. The fund has returned -30.8% over the past year. In April 2022, HERO returned -11.7%.
The top three holdings with their asset percentage are:
- Activision Blizzard Inc — 7.91%
- Nintendo Co Ltd — 7.00%
- Electronic Arts Inc — 6.33%
№ 2. Wedbush ETFMG Video Game Tech ETF (GAMR)
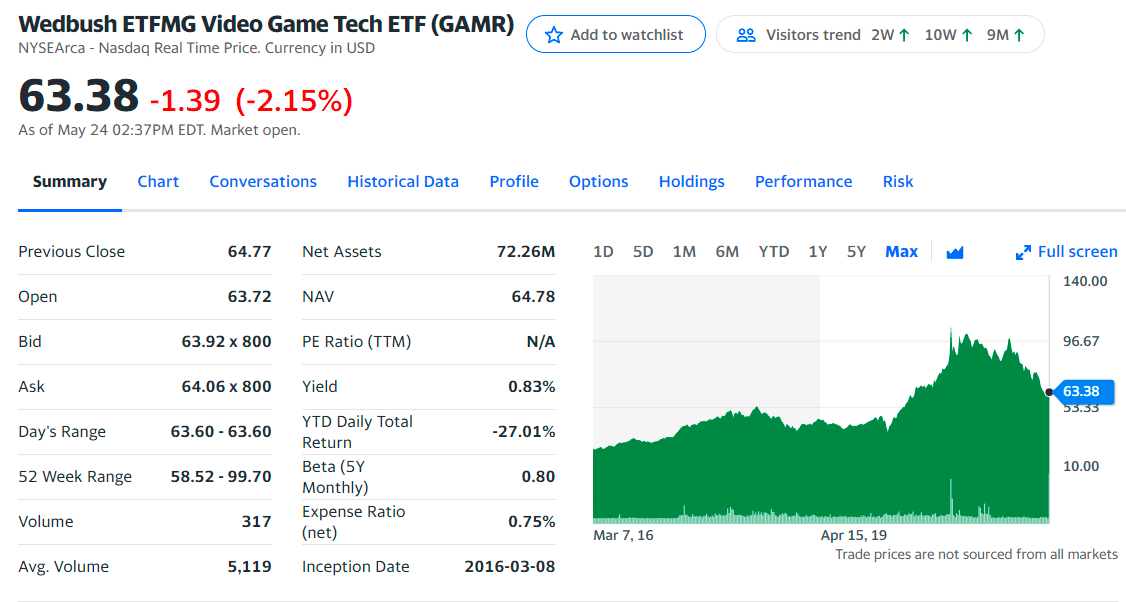
GAMR ETF summary
It was launched in 2016 and managed by Samuel Masucci since January 31, 2018, at ETFMG.
GAMR is similar to NERD, with only about $100 million in assets. Technically, it is a more “pure play” on video game creators and supporters and retailers, but it weirdly has about 1/4 of its holdings in GameStop.
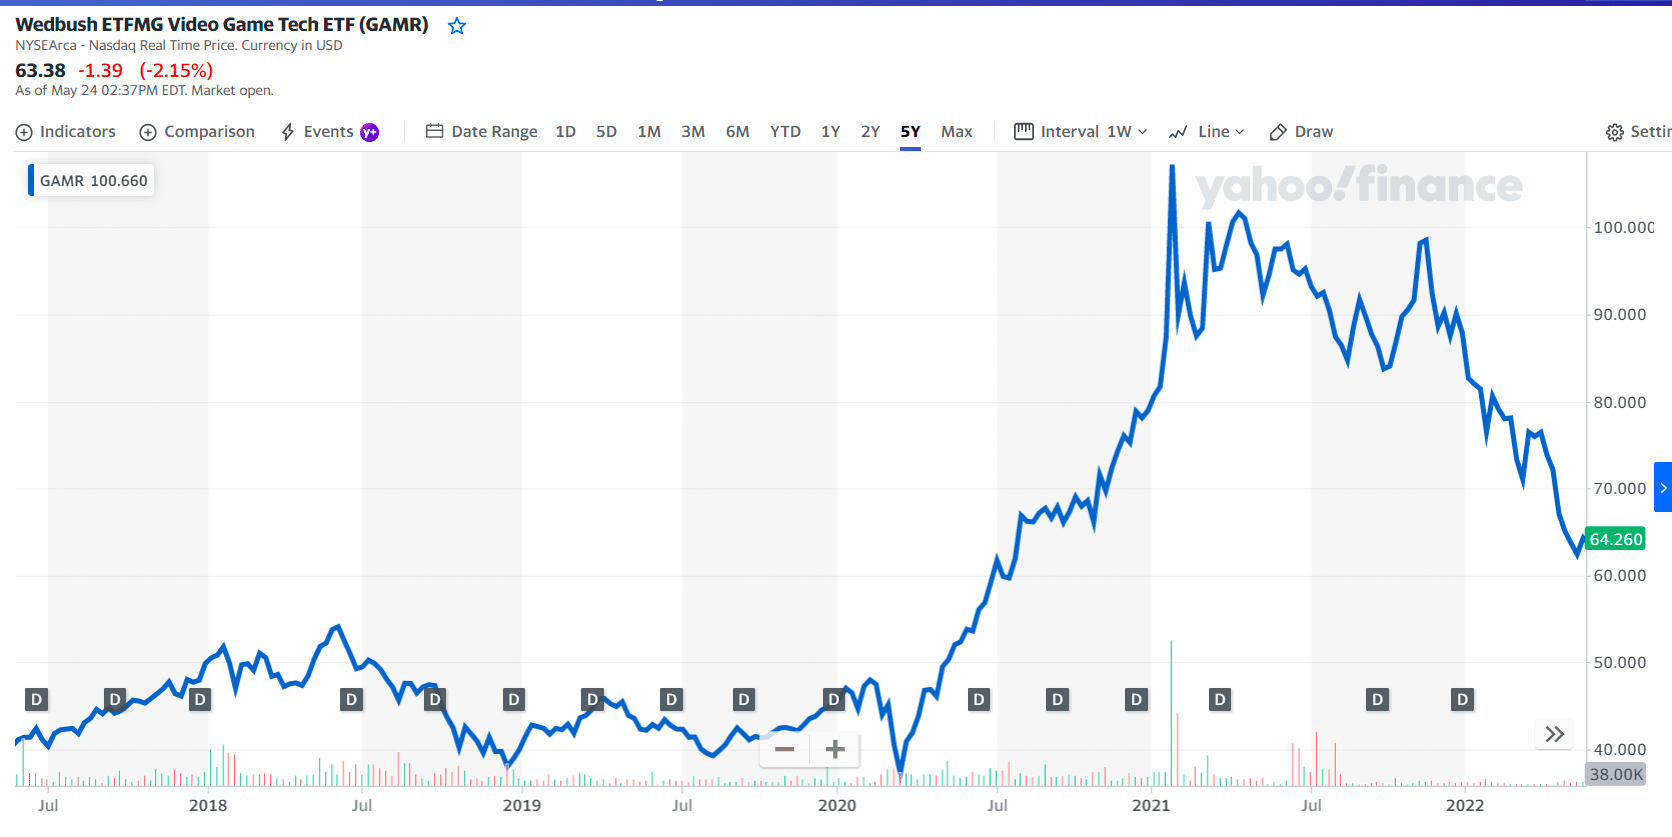
GAMR price chart
Its expense ratio is above average compared to funds in the Technology category. GAMR has an expense ratio of 0.75%, 34% higher than its category.
The fund has returned -31.7% over the past year and 15.3% annually over the past three years. In April 2022, GAMR returned -13.9%. It has an R-squared of 21%, a beta of 0.80, and a standard deviation of 31.5%. It has a high total risk rating.
The top three holdings with their asset percentage are:
- ETFMG Sit Ultra Short ETF — 2.54%
- PearlAbyss Corp — 2.32%
- Unity Software Inc Ordinary Shares — 2.14%
№ 3. Roundhill BITKRAFT Esports & Digital Entertainment ETF (NERD)
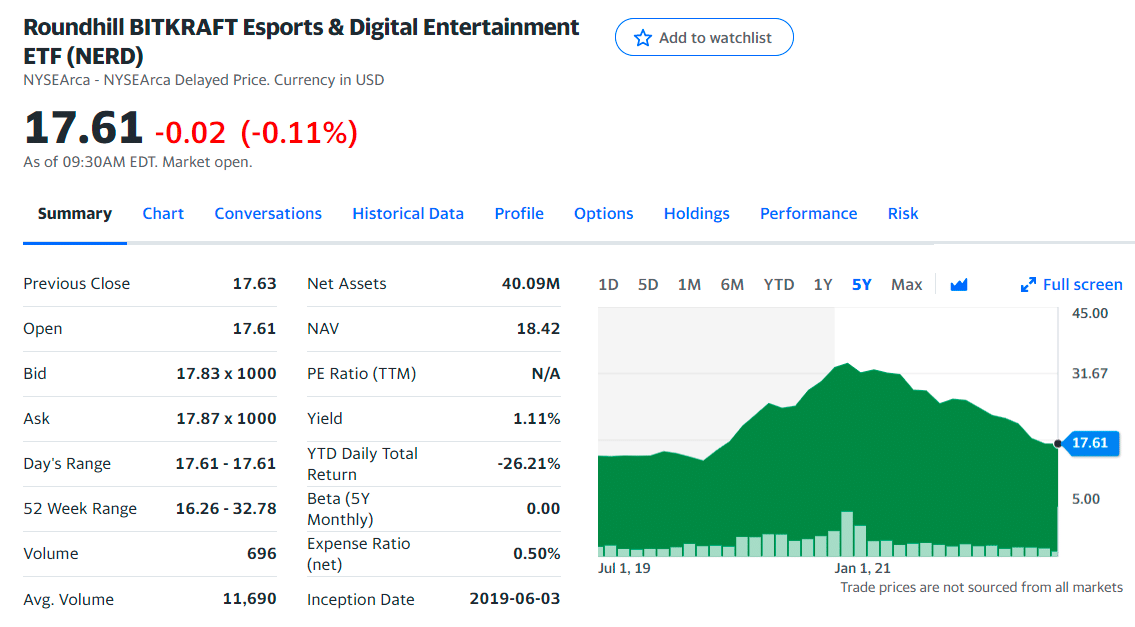
NERD ETF summary
It was launched in 2019 and managed by Travis Trampe since June 3, 2019, at Roundhill Investments.
NERD is an ETF that tracks the performance of the Roundhill BITKRAFT Esports Index. The index tracks the performance of the common stock of exchange-listed companies that earn revenue from electronic sports or esports-related business activities.
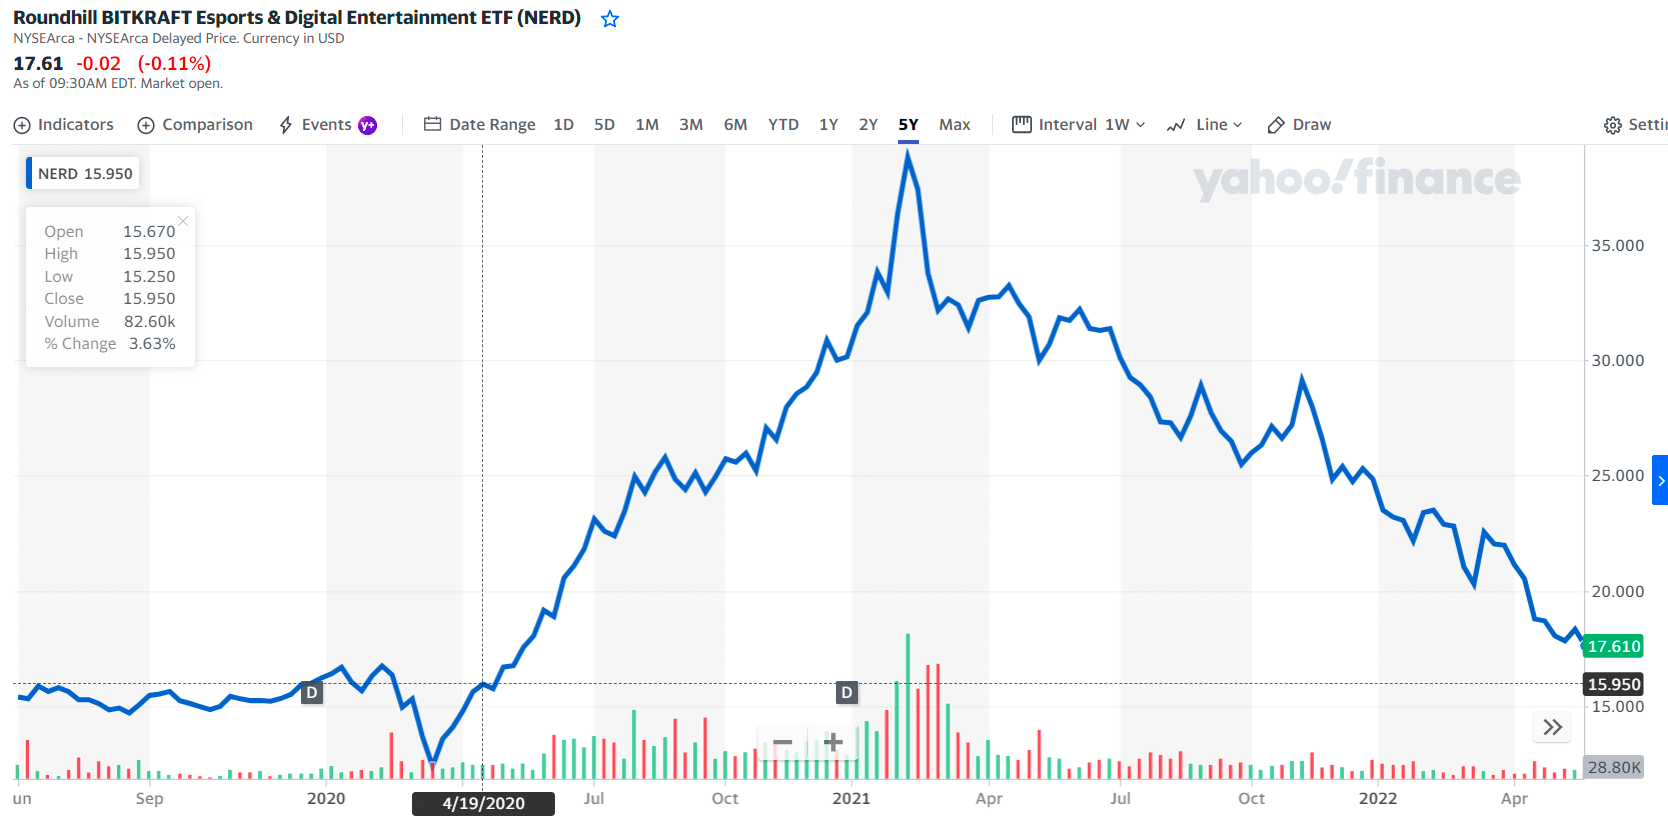
NERD price chart
NERD has an expense ratio of 0.50%, 6% lower than its category. Its expense ratio is average compared to funds in the Consumer Cyclical category. The fund has returned -42.0% over the past year. In April 2022, NERD returned -13.1%.
The top three holdings with their asset percentage are:
- Modern Times Group MTG AB B — 5.90%
- Activision Blizzard Inc — 4.87%
- AfreecaTV Co — 4.78%
№ 4. VanEck Vectors Video Gaming and eSports ETF (ESPO)
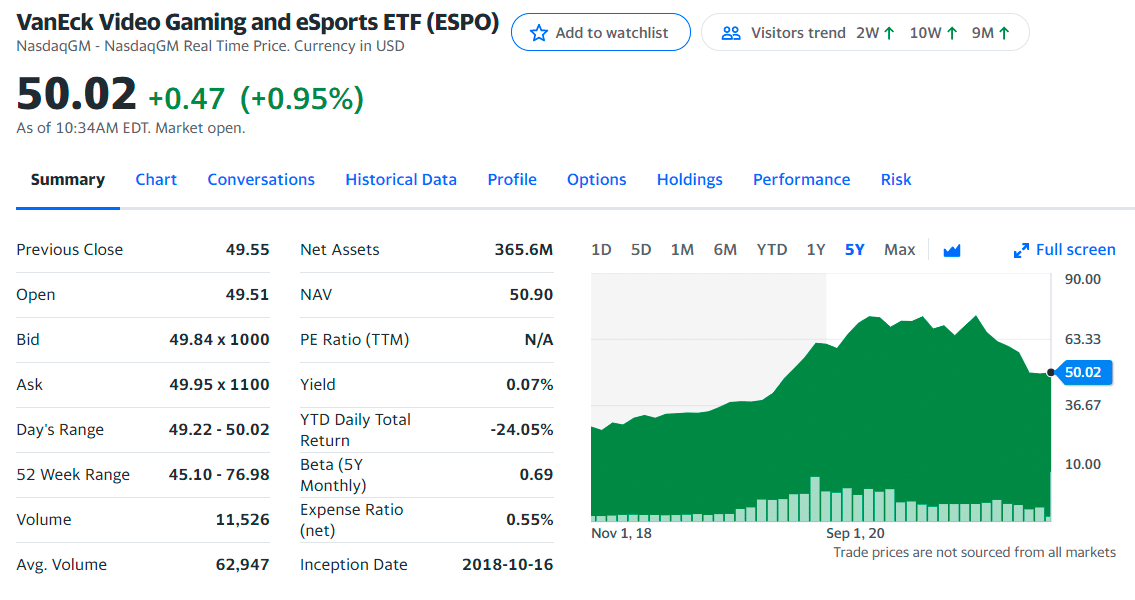
ESPO ETF summary
It was launched in 2018 and managed by Guo Hua (Jason) Jin since October 16, 2018, at VanEck.
ESPO is an ETF that tracks the performance of the MVIS Global Video Gaming & eSports Index, an index that tracks the performance of companies in the global video gaming and eSports segment.
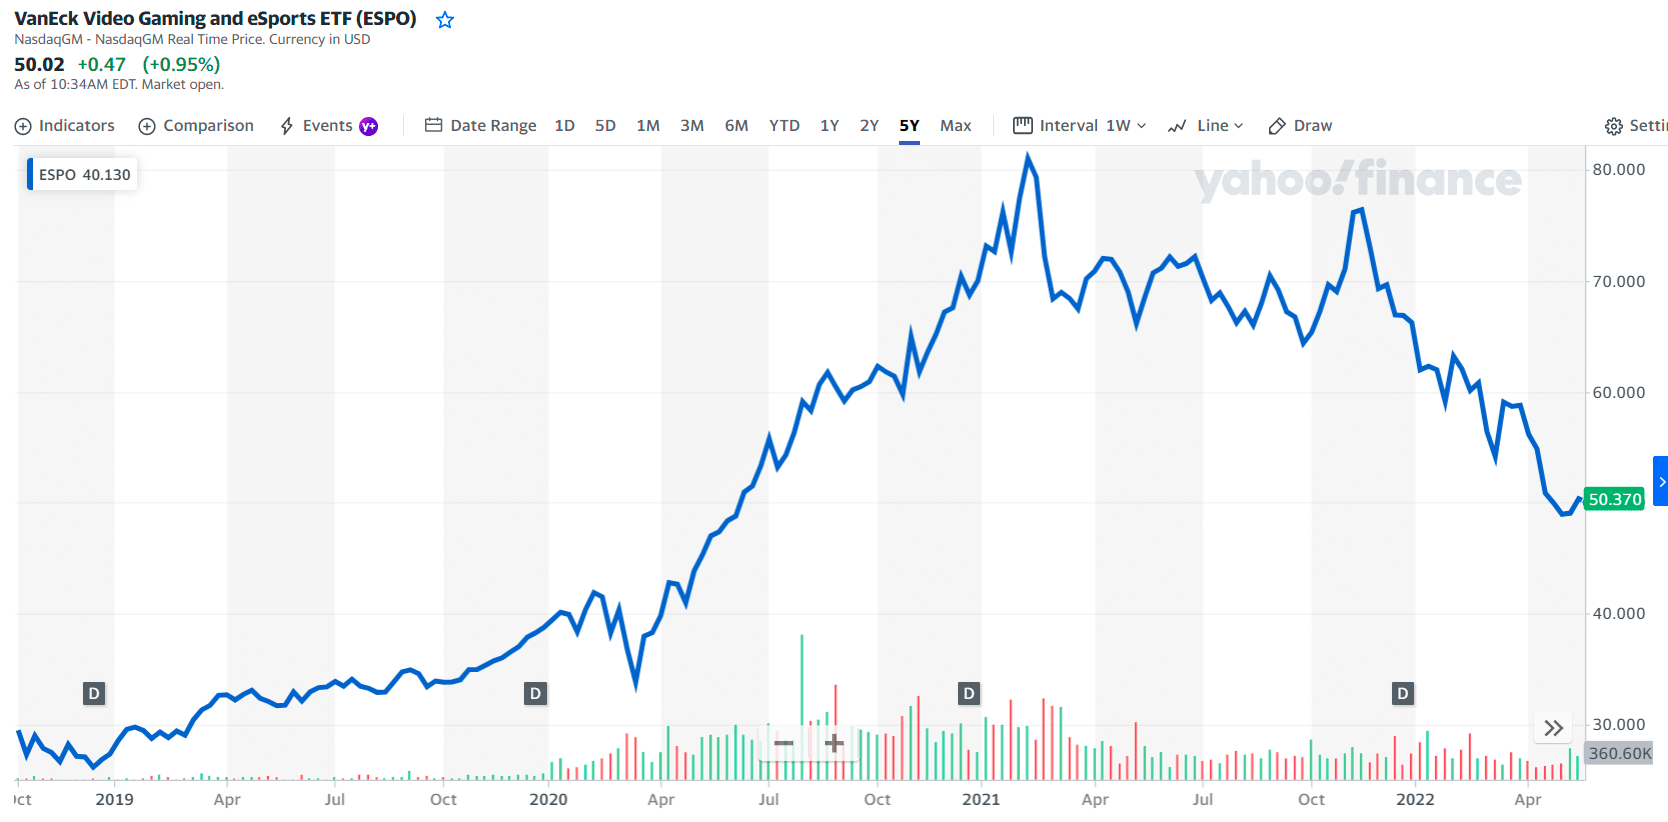
ESPO price chart
Its expense ratio is average compared to funds in the Technology category. ESPO has an expense ratio of 0.55%, 2% lower than its category. The fund has returned -26.7% over the past year and 16.6% annually over the past three years. In April 2022, it returned -14.0%.
ESPO has an R-squared of 38%, a beta of 0.69, and a standard deviation of 20.1%. It has an average total risk rating.
The top three holdings with their asset percentage are:
- NVIDIA Corp — 9.06%
- Advanced Micro Devices Inc — 8.08%
- Tencent Holdings Ltd — 7.62%
№ 5. iShares PHLX Semiconductor ETF (SOXX)
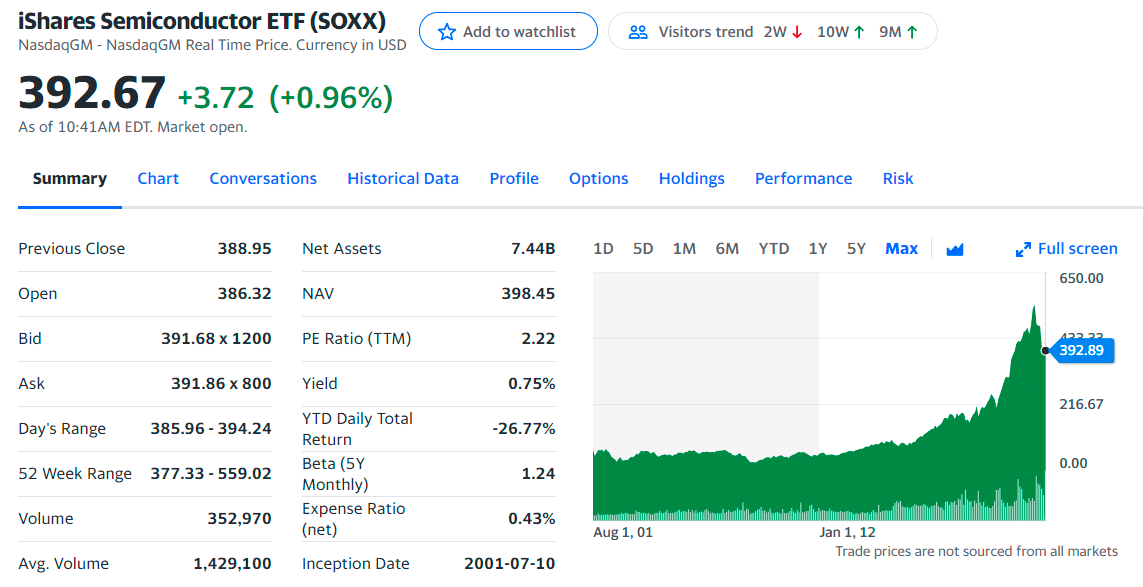
SOXX ETF summary
It was launched in 2001 and managed by Greg Savage since January 1, 2008, at iShares.
SOXX is not a video game ETF, but remember; there are not many video game ETFs. Some semiconductor makers are heavily involved in the video game and competitive gaming markets. That includes Nvidia, the largest holding in SOXX.
While that is not enough to make this chip fund a video game ETF, it is enough to make SOXX an appropriate option for investors looking for indirect video game exposure via the ETF wrapper.
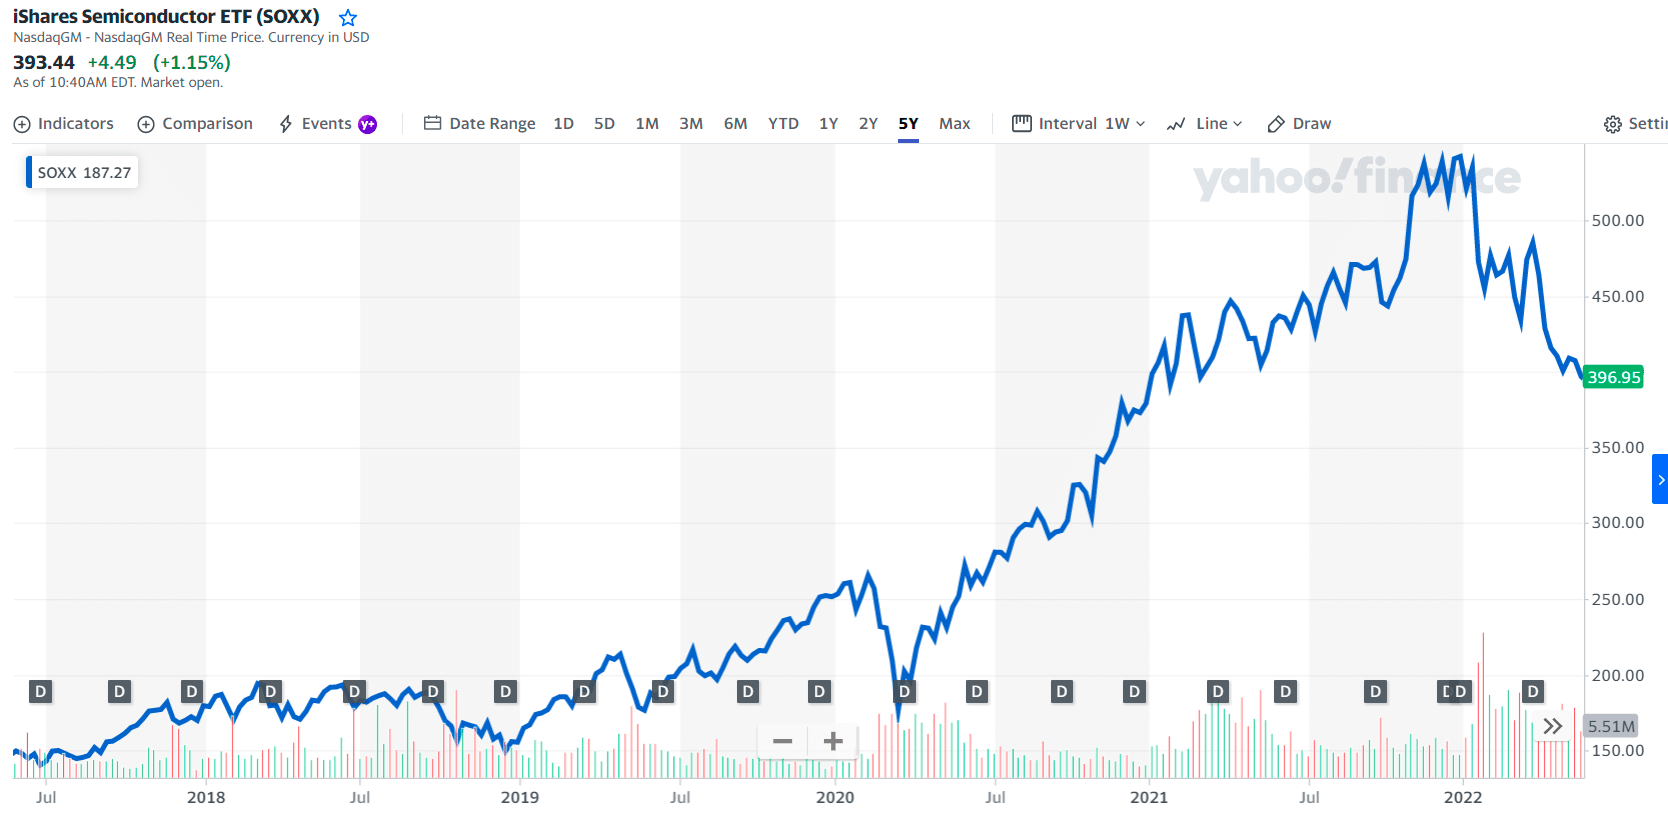
SOXX price chart
Its expense ratio is average compared to funds in the Technology category. It has an expense ratio of 0.43%, which is 23% lower than its category. The fund has returned -4.5% over the past year and 25.1% annually over the past three years, 25.4% per year over the past five years, and 23.2% per year over the past decade. In April 2022, it returned -15.3%.
SOXX has an R-squared of 71%, a beta of 1.24, and a standard deviation of 26.5%. It has an above-average total risk rating.
The first three holders with their asset percentage are:
- NVIDIA Corp. — 9.08%
- Broadcom Inc. — 7.77%
- Intel Corp. — 7.11%
Final thoughts
From now on, broader trends, including demographic shifts, changing consumer demands, cord-cutting, internet penetration, and developing technologies such as 5G, will continue to fuel the growth of the video game ecosystem.


Comments