

Indicator trading is one of the most familiar strategies in the crypto market. Sometimes market participants use a couple of indicators, but they utilize a bunch of such tools at other times. They often lose sight of the overall picture when they do the latter because their charts are overcrowded.
One tool that many traders cannot do without is the RSI. Developed in 1978 by Welles Wilder, the RSI stands the test of time and remains relevant even to this day. You can use it to trade overbought/oversold conditions or momentum trading.
Finally, RSI is a powerful tool for trading divergences. As you keep reading, you will understand how to trade the divergence signals provided by this tool. That is what you are going to learn in this post. Before that, let us review what an RSI divergence is in the next section.
What is RSI divergence in crypto?
Compared to overbought/oversold signals, RSI divergence trading signals are more reliable and lead to fewer incorrect readings. An RSI divergence is occurring means that the indicator does not agree with what price is doing. The image below shows that divergence may cause a reversal or continuation depending on the market structure.
- A bullish RSI divergence occurs if the price prints a lower low while the RSI records a higher low. This event signifies that the selling momentum is losing steam and that the price might turn around.
- Meanwhile, a bearish divergence happens if the price prints a higher high, but the RSI records a lower high. This episode indicates that the buying momentum is waning, and the trend might reverse down or pullback soon.
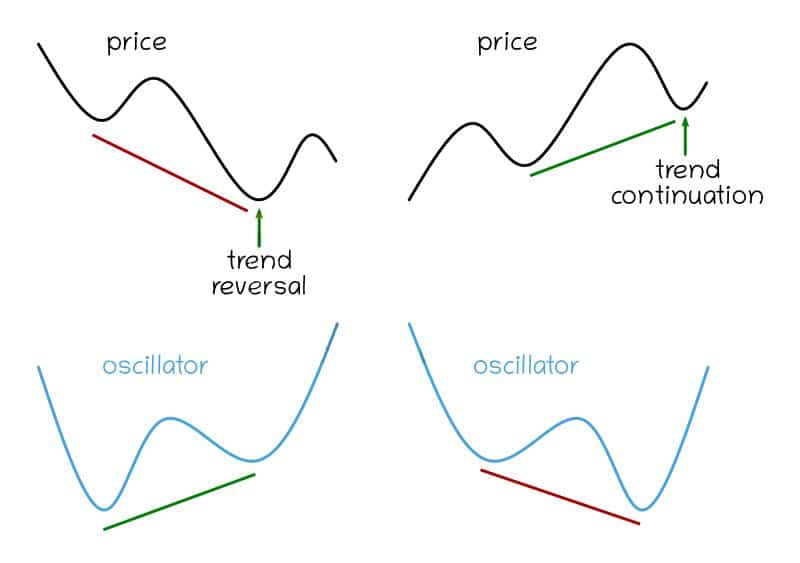
A schematic diagram of divergence
How to test the RSI divergence technique?
There are at least three ways to test an RSI divergence or any other strategy. These methods are explained below:
-
Manual backtest
You can use a substantial amount of historical data as you please. This method involves applying the RSI indicator to any crypto chart and checking how the RSI divergence signals fare in the past. You can go as far back as five years or more, but you must determine this in advance. Then you can count how many RSI divergence signals you get within that period and how many succeeded or failed.
-
Automated backtest
If you know how to code an expert advisor or you know someone who does, you can have an expert advisor do the backtest on your behalf. Compared to a hand test, automated backtests are completed very quickly. You can also pay a developer to write the program for you.
-
Forward test
Compared to the previous two approaches, forward testing is more reliable. The reason is that forward testing or demo trading uses real-time market data. You can either do it manually or automatically using a robot with this approach. The downside to this method is that it might take some time before you can get a signal and generate a good sample of trades for analysis.
Bullish setup

Bullish divergence on Bitcoin hourly chart
Bullish trading conditions
- Best time frames to use: hourly, four-hour, and daily.
- Entry: last bullish candle of the last swing low.
- Stop loss: last swing low.
- Take profit: nearest swing high after the bullish divergence forms.
The above hourly chart of BTC shows a series of RSI bullish divergence. This is called a serial divergence, which is more powerful than a single regular divergence. As you can see, the price quickly takes off dramatically after the divergence plays out. This is the power of RSI divergence. You might take failed trades while looking for the real reversal, but it often happens.
Bearish setup
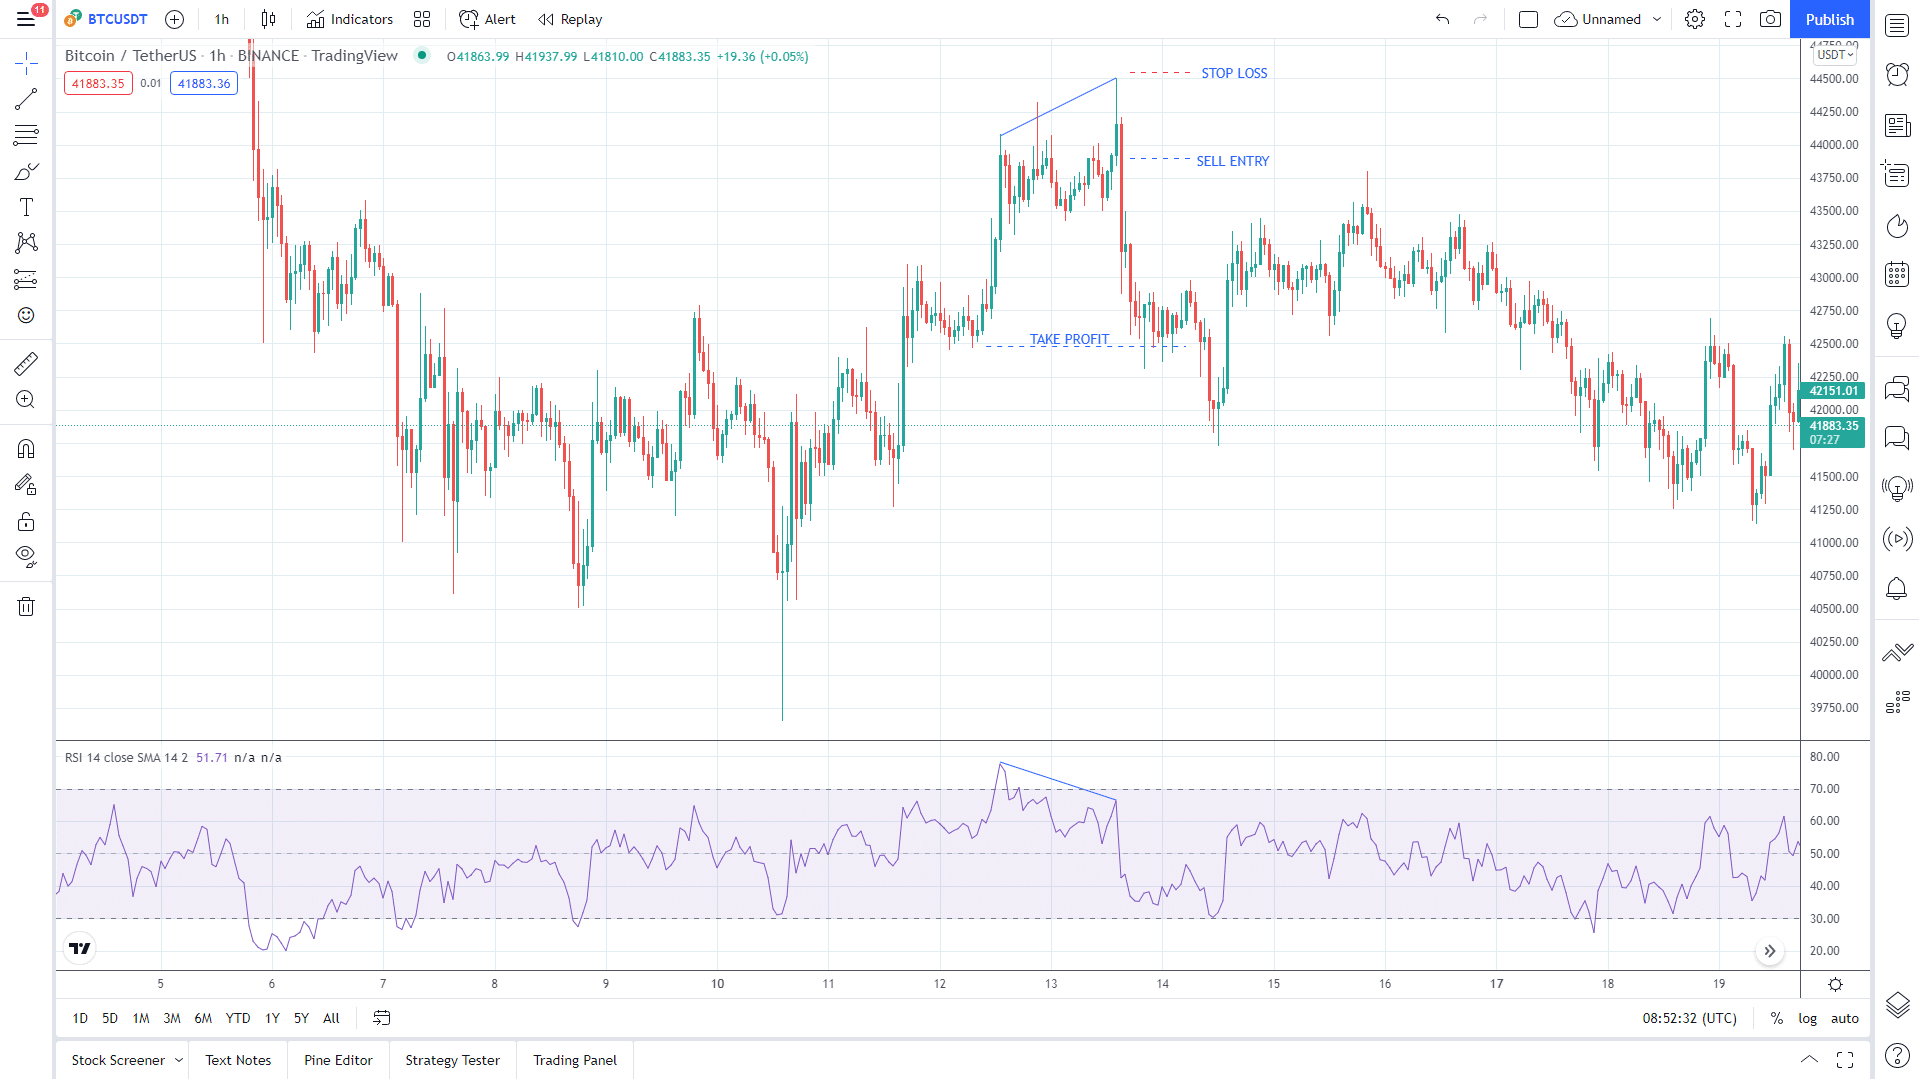
Bearish divergence on Bitcoin hourly chart
Bearish trading conditions
- Best time frames to use: hourly, four-hour, and daily.
- Entry: at the close of the previous candle with a long wick.
- Stop loss: high price of the entry candle.
- Take profit: nearest swing low.
The above chart shows a single bearish RSI divergence setup on the same chart. As in this case, sometimes the entry can be tricky. You might need to draw upon your experience to have the confidence to pull the trigger even if the setup does not look perfect. As long as you seek to achieve a bigger reward than your potential risk, taking this type of entry is not bad at all.
Another thing to note is that a divergence signal is not foolproof. A market reversal does not always happen. However, you can expect a correction of the trend. While you can shoot for a bigger target in this setup, there is a possibility that the price will go against you momentarily and eventually go in your desired direction. To be safe, try to find a target close to entry that can still give you the intended reward-to-risk ratio.
Pros and cons
RSI divergence is easy to implement once you understand how it works. It can make you profitable if you use it correctly. However, you could lose trades from time to time, which might affect your psychology. Therefore, you must know the pros and cons of the strategy before you apply it to your trading.
| Pros | Cons |
| A divergence signal is generally more effective than an overbought/oversold signal. | Divergence does not always lead to market reversals. Often you can get a slight reaction or correction. On a few occasions, price ignores the divergence signal. |
| It is easy to spot divergence setups on the chart. | Price may form a series of divergence consisting of three or more lunges before price reverses or corrects. You might lose one or more trades before you can get a profitable trade. |
| Divergence signals occur in any time frame. The rule of thumb is that the higher the time frame, the more effective the signal is. | Setting the stop loss of a divergence trade can be challenging. You have to rely on experience and a bit of luck to win some trades. |
Final thoughts
Trading the crypto market can be more challenging than investing. While investing involves buying and holding, trading requires understanding the risk exposure in every trade and cutting losing trades quickly. Otherwise, you might lose big time when the market moves against you. Remember that the crypto market is significantly more volatile than others.
While the RSI divergence system can score you a series of wins here and there, you must not lose sight of risk. Success in crypto trading requires a solid trading strategy and sound money management to keep you playing the game long enough. Be sure to have a complete trading plan before engaging the crypto market as a trader.


Comments