
The versatility of indicators for analyzing cryptocurrencies can be accessed through mathematical methods for calculating readings. The initial data are usually used — the price of an asset or information about trading volumes.
Several features differentiate the altcoin market from classic investment assets. First of all, we are talking about the high volatility of digital asset rates and gaps. Not every indicator that effectively predicts the direction of price movement in fiat instruments can cope with its task on cryptocurrency pairs.
That is why we decided to prepare an up-to-date list of the most influential crypto analysis tools that you can use to build a profitable trading strategy.
1. Moving averages: the lagging indicator
Central banks and international corporations drive the currency market. As a result, it is critical to comprehend what is going on at the macro level.
The moving average (MA) is a crypto indicator that describes the overall market sentiment by taking the average price of previously closed candles.
- When the price is holding over the MA, it signals that buyers control the price.
- If the cryptocurrency pair is trading underneath the MA, it symbolizes that sellers influence the price.
As a result, if the price is beyond the MA, one should focus your trading approach on purchase trades. Furthermore, the simple moving average (SMA) confers the average price of the recent candles, which assists traders in understanding the market environment. The exponential moving average (EMA) concentrates on the most recent movement, which assists traders in entering a trade.
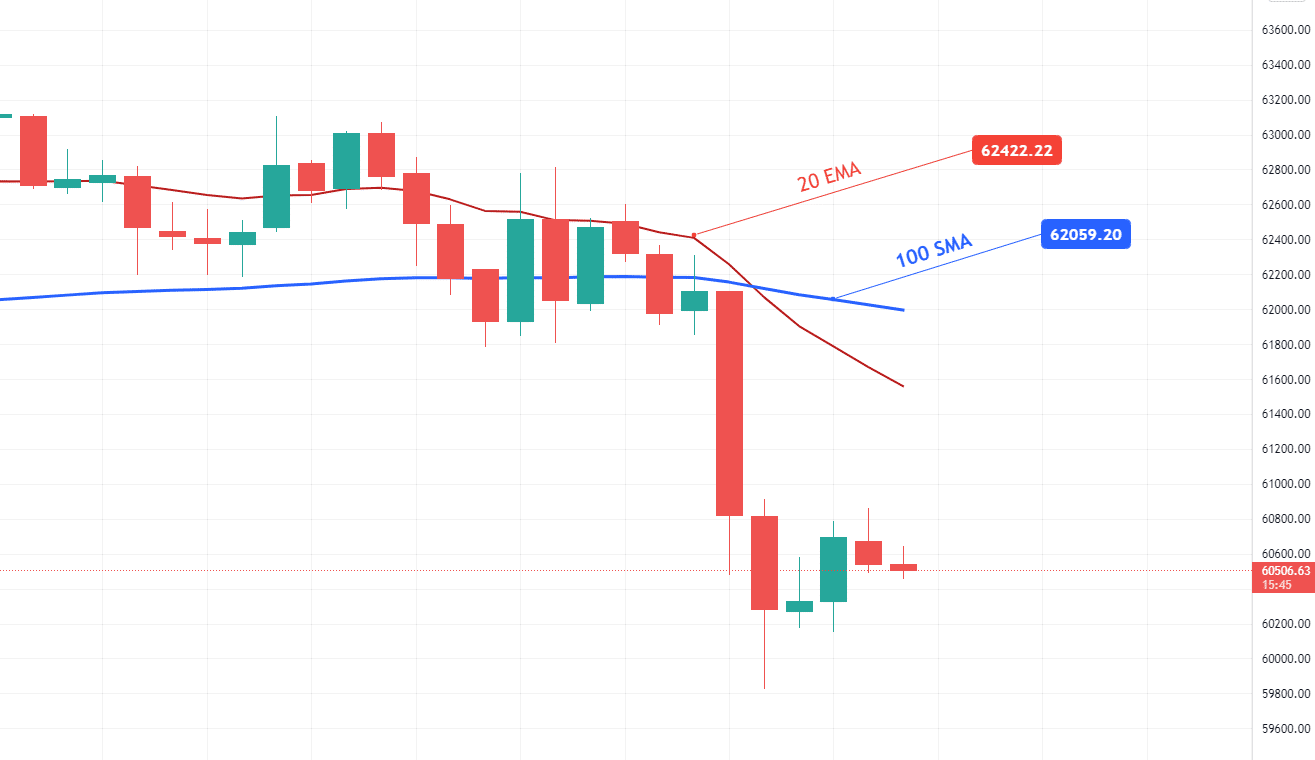
BTC/USD chart indication of the moving average
The chart above depicts the 20-day EMA and 100-day SMA crossover for the BTC/USD pair. The notion here is that the trend is bearish when the 20-day EMA (in red) is lower than the 100-day SMA (in blue). When such a bearish crossover appears, it indicates a selling trend and promotes bearish trades.
Alternatively, the formation of candles below the SMA and EMA lines suggests a selling trend in the crypto pair and vice versa.
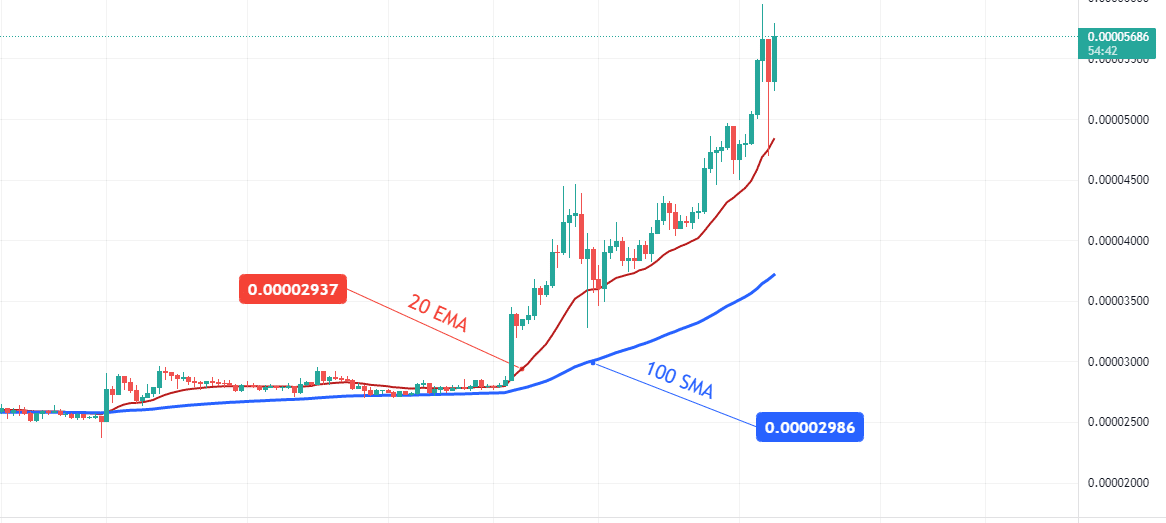
SHIB/USD chart indication of the moving average
On the flip side, the 20 EMA has crossed the 100-day SMA from the downside to the upside. It’s called a bullish crossover and typically triggers a bullish trend in the market. Alternatively, the closing of candles above the 20-day and 100-day MA suggests a bullish trend in the market, and traders should be looking for a buy trade in such a scenario.
2. Relative strength index (RSI): an overbought/oversold tool
After deciding to follow the primary trend’s direction, a crypto trader must determine whether it is more confident stepping in — when a definite trend is formed or after a downturn. If you want to get in soon, enter a trade when an upswing or decline is verified. On the flip side, you may want to wait for a bearish or a bullish correction within a primary trend to take an entry. A trader will use an overbought/oversold indicator for this.
The three-day relative strength indicator uses historical prices to drive an outcome and returns a value of 0 to 100.
- If all price movement is on the upside, the indicator will soar to 100.
- If all price movement is to the downside, the indicator will approach 0.
- A reading of 50 is regarded as neutral.
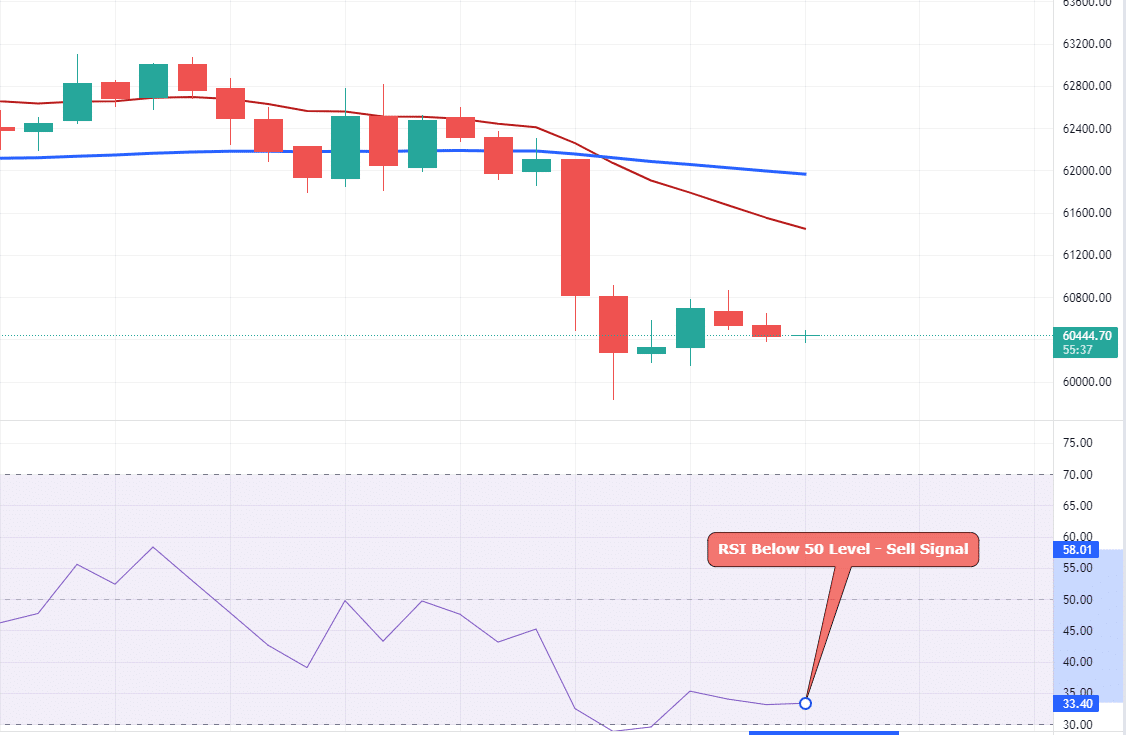
BTC/USD chart with RSI
The RSI is a leading technical indicator that ranges from 0 to 100 levels. It foretells where the price will most likely revert.
- Overbought
When the price of an uptrend moves above the 70 level, it suggests chances of a negative market reversal.
- Oversold
If the price falls below the 30 level in a downtrend, it signals the odds of a bullish market turnaround.
RSI creates trading opportunities by diverging from the price. Since it’s a leading indicator, you can’t fully trust it. Therefore, one should use it with a blend of other technical tools.
3. Movement Average Convergence and Divergence (MACD)
We now have a trend-following technology that can tell us whether a particular cryptocurrency’s major trend is up or down. But how dependable is that technical indicator? As previously stated, trend-following tools are prone to whipsaw. As a result, it would be helpful to have a mechanism to determine whether the present trend-following indicator is correct or not.
We shall use a trend-confirmation tool for this, which could be designed to provide particular buy and sell recommendations. Instead, we want to see if the trend-following and trend-confirmation tools agree.
- If both are positive, a trader can contemplate entering a long trade in the cryptocurrency pair more confidently.
- If both are bearish, the trader can concentrate on finding a way to sell/short the cryptocurrency.
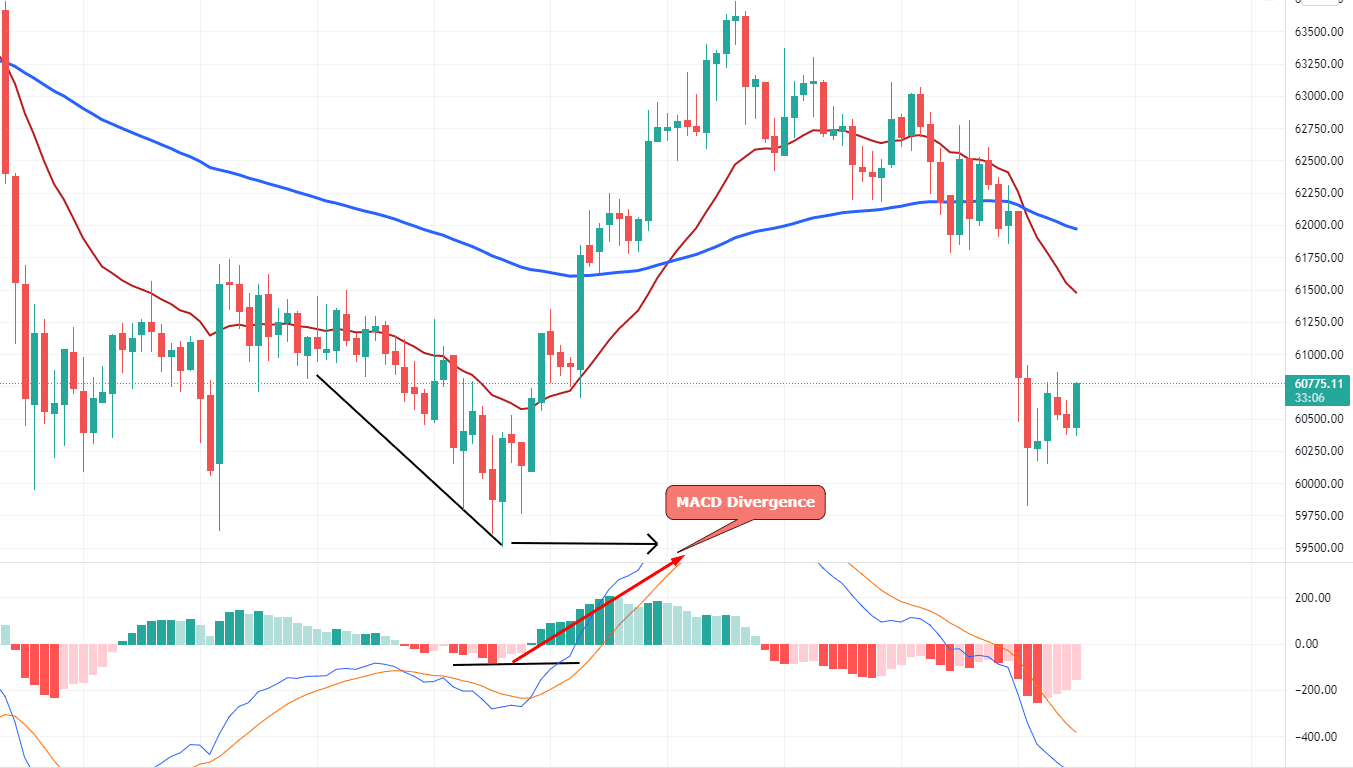
MACD indicator on BTC/USD chart
MACD is one of the most popular crypto indicators. It is a trading tool that combines a histogram and an EMA. This indicator’s primary use is to compute divergence from the price. The normal divergence between MACD and price signals a market reversal, but the hidden divergence signals a continuation.
- A reading above 0 indicates a bullish bias.
- A reading below 0 indicates a selling trend in the market.
4. Average True Range (ATR)
It is also one of the leading technical tools, and it shows the cryptocurrency pair’s volatility. Estimating volatility is critical in the crypto market as it’s tied to direct market movement.
An increase in volatility signals a market reversal in every financial market, while a decrease in volatility signals a market continuation.
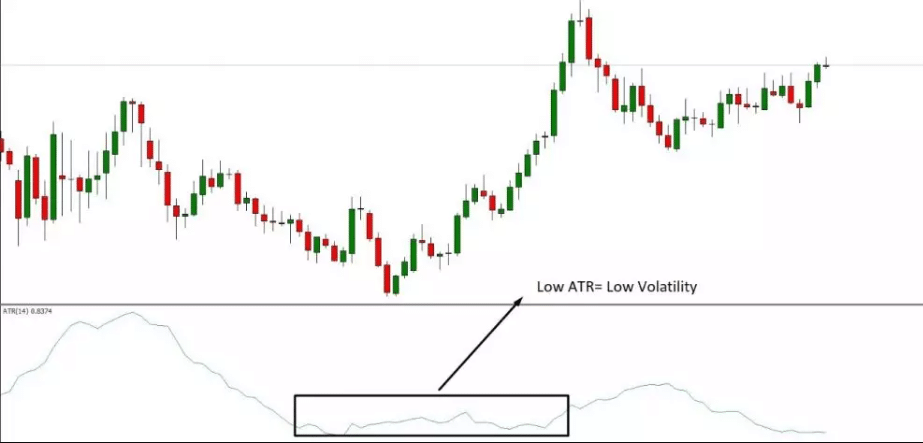
ATR indicator
The smaller the ATR, the lower the volatility, and the higher the ATR, the higher the volatility. As a result, if volatility is minimal, you can increase your take profit. Lower volatility, on the other side, can provide reversal trade setups.
5. Parabolic SAR
It shows a cryptocurrency pair’s market trend. The general trend is bullish if the price is over the Parabolic SAR. Conversely, if the price falls underneath the SAR, the overall trend is negative.
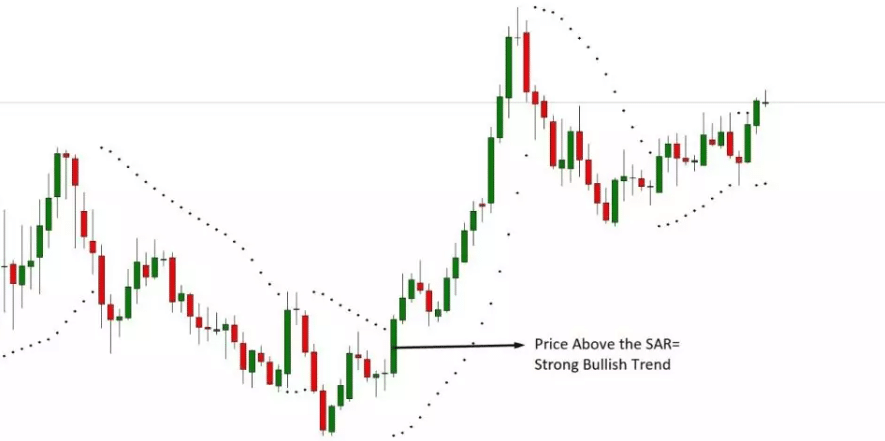
Parabolic SAR indicator
Traders use this indicator to conclude the direction of the trend. In addition, a cryptocurrency’s rejection at the Parabolic SAR tool indicates a possible entry position.
Final thoughts
The effectiveness of a technical trading tool depends on how you use it. Traders frequently employ many indicators with varying settings to increase the likelihood of a market shift. It’s possible to develop lucrative techniques for trading a cryptocurrency by being familiar with a wide range of technical tools. Thus, this helps reduce the risk and improve profitability.


Comments