
Technical indicators are among the most effective tools a trader can have to make trading decisions. They work in all kinds of time-frames, and when you learn to read them, they can help you make a lot of money. Moreover, they are so versatile that even when they don’t behave how we expect, we can get signals from them.
That’s the case of divergence. This event tells us that the behavior of the indicators is not the same as the price’s behavior, and that is a strong signal about where the price is going. You can learn how to use this powerful tool to your benefit to profit as many other traders do. Take a look at how this tool can help you improve your trading.
What is divergence?
Normally, when using oscillators, the movement of the price and the indicators are similar, but this is not always this way.
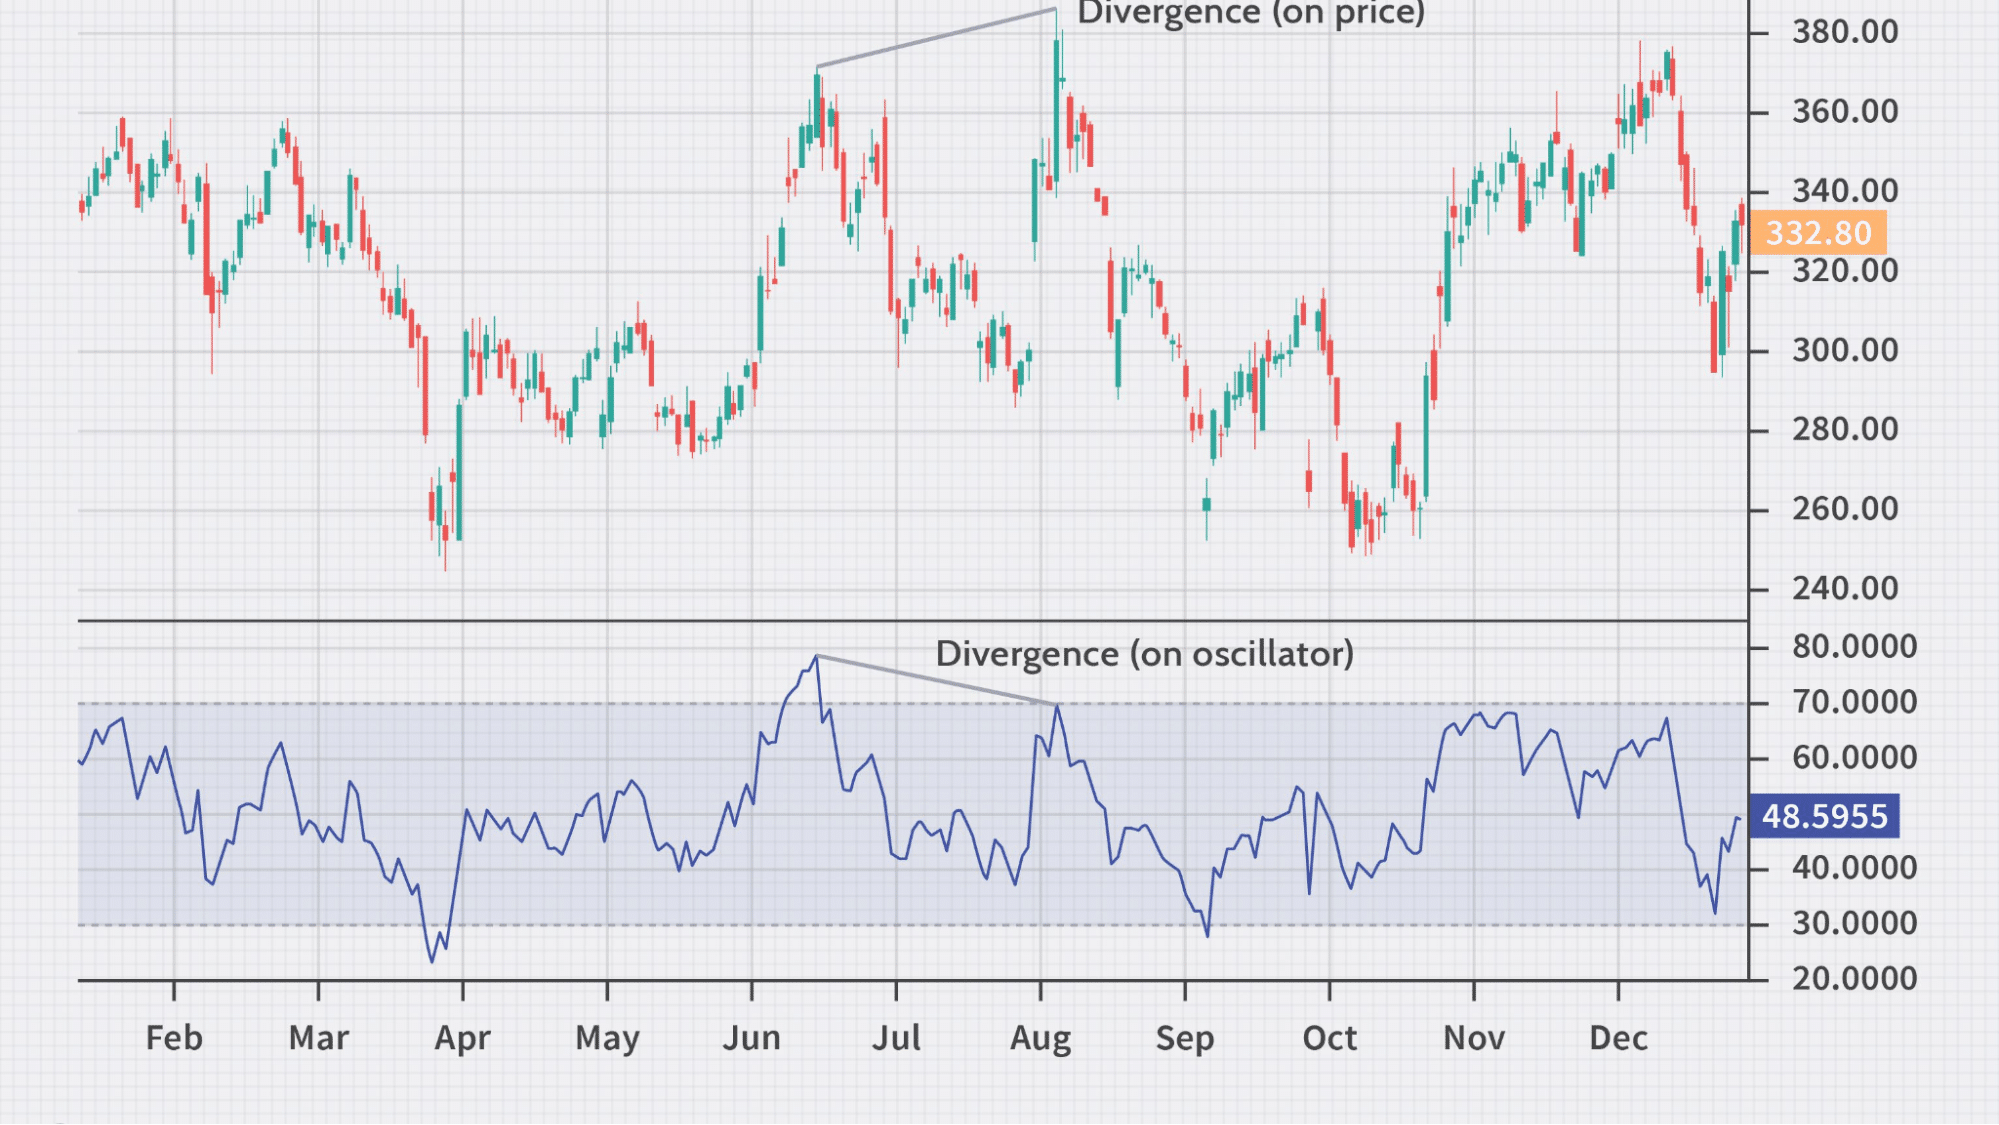
Divergence is when the highs and lows from the price chart go in different directions from the highs and lows from the indicators. So there are the bearish divergence and the bullish divergence.
We have a bearish divergence when the price reaches higher highs, but the indicators show lower highs. This is a sign that the trend is getting weaker, and it will reverse to start a bearish trend.
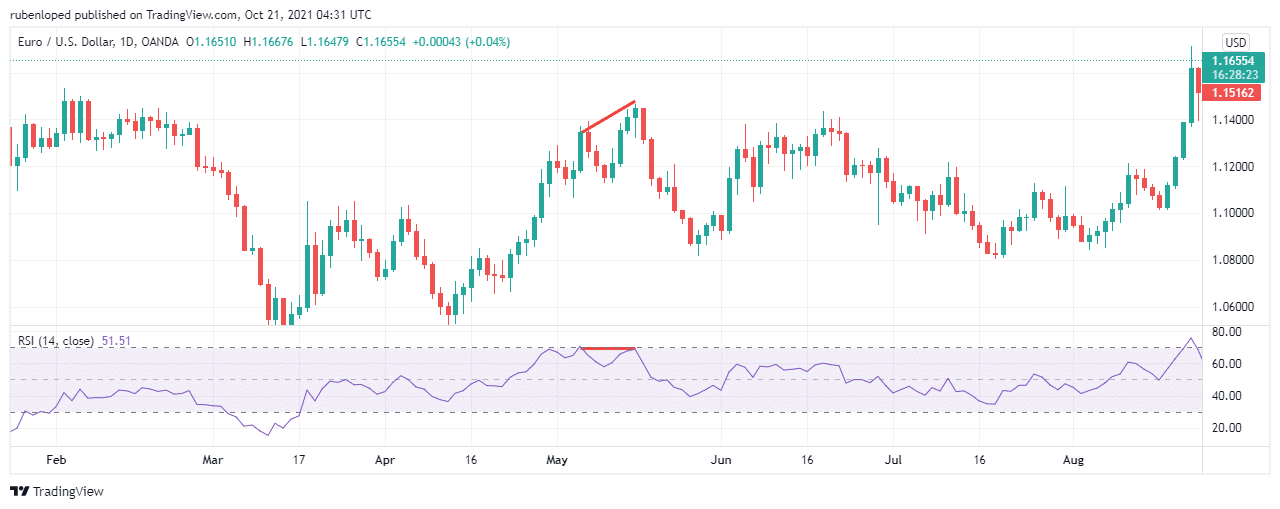
Bearish divergence. Higher highs in the price chart and lower highs in RSI
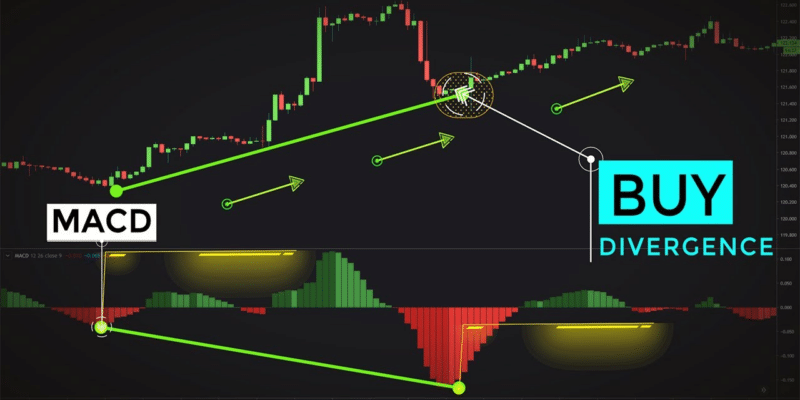
On the other hand, a bullish trend is the one you get when you see lower lows in the price chart but higher lows in the indicators.
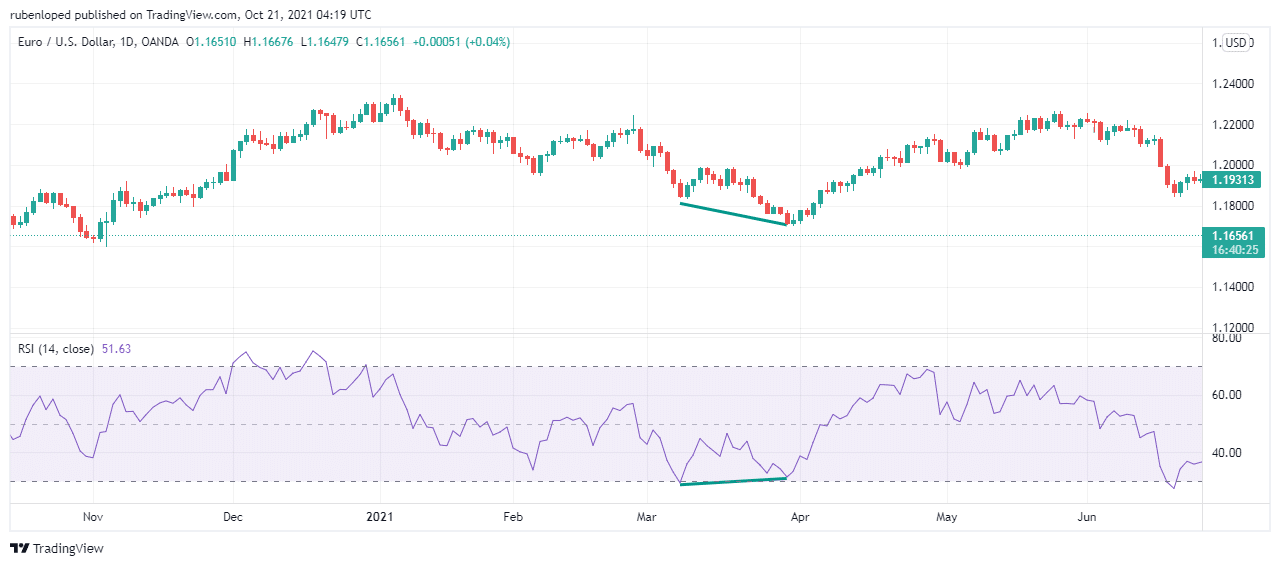
Bullish divergence. Lower lows in the price chart and higher lows in RSI
What technical indicators to use when looking for divergence?
The best indicators to use to find divergences are the oscillators. These indicators have similar movements as the price, and the high and lows generally match the highs and lows of the price chart, so when they differ, it’s a lot easier to spot the divergence.
The oscillators traders use the most are:
- Stochastics
It’s a technical indicator that compares the closing price to the prices of a certain period. It is a relative measure, and the levels of 80% and 20% are strong signals to sell and buy, respectively.
- Relative Strength Index (RSI)
A momentum indicator measures recent price movements to determine whether an asset is overbought or oversold.
- MACD
The MACD evaluates the relation between different moving averages to decide when to buy or sell the security
- Williams Percent R
As the stochastic and the RSI index, Williams percent R moves in a range between 0 and 100. Below 20% of traders consider the security oversold, and above 80% they considered overbought.
What does divergence tell you?
Divergence can be read in at least four different ways. The traditional way signals a reverse in the trend, whether it is a down-trend or an up-trend. In addition, however, there is a kind of divergence called hidden divergence.
In contrast to traditional divergence, this indicates a continuation pattern. What they both have in common are the different patterns you can see in the charts.
Divergence can sometimes be a little hard to find and not always well-read. That is why we are going to give you five tips to trade the divergence like a pro.
Top five tips for trading the divergence
Divergence is a strong pattern, but even so, we don’t recommend trading based on divergence alone. Like any other technical indicators, the more confirmation we get, the better. Unfortunately, many traders make mistakes when using divergence.
We are going to show you now the best five tips to trade the divergence.
Tip 1. Indicators
The correct kind of indicators to use when looking for divergence are oscillators. For divergence, we are trying to find trends that are getting weaker and oscillators reflect momentum, so they are the perfect indicators for the job.
How does this happen?
To find these oscillators, you simply go to your broker’s platform, choose the insert option, then indicators and finally choose the indicator you prefer.
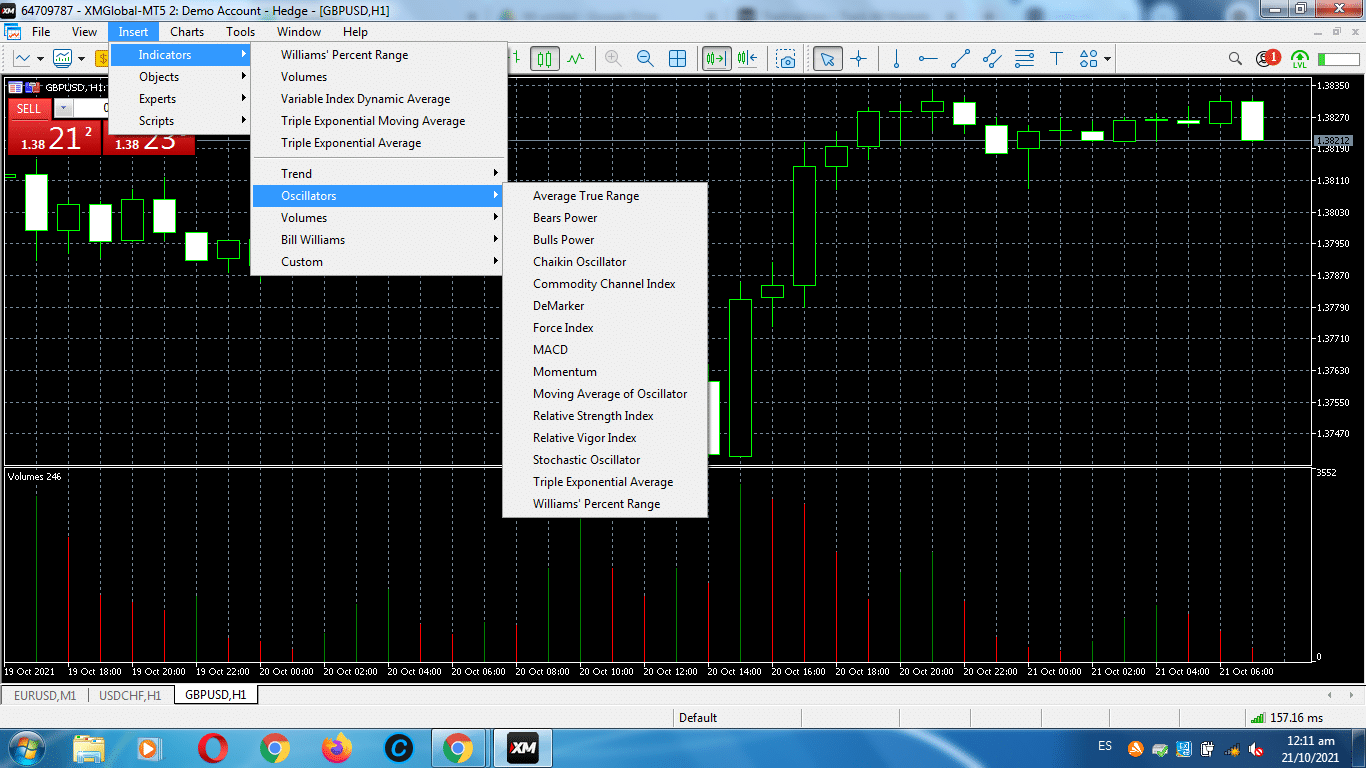
Indicators in MT5
How to prevent the fault?
Only use momentum indicators with this strategy. If you try to use other indicators, you won’t get the different patterns you are looking for.
Tip 2. Time frame
The time frame, like with most indicators, plays a key role here. Therefore, it is not a surprise that the longer the period, the stronger the signal. Moreover, longer periods offer greater rewards than shorter ones since the trends are longer.
How does this happen?
We recommend using divergence in periods longer than 1-hours. This not only makes the divergence signal stronger but also the other indicators that confirm the movement.
How to prevent the fault?
Avoid trading in a time frame shorter than 1-hour since the volatility of the asset can produce many false signals that could lead you to losses.
Tip 3. Identify the type of divergence
You have to take your time to find the divergence. That’s also a reason to trade longer time frames. With periods below 1-hour, it is likely that once you identify the divergence, the opportunity is already gone.
Also, you need to understand well if it is a reversal or a continuation pattern. If you don’t do it right, it will lead you to totally different ways. For example, instead of earning, you may end up losing.
How does this happen?
- Bullish divergence: price makes lower lows and the indicator higher lows.
- Bearish divergence: price makes higher highs and the indicators lower highs.
- Hidden bullish divergence: price makes higher lows and the indicator lower lows.
- Hidden bearish divergence: price makes lower highs and the indicators higher highs.
How to prevent the fault?
It is not just about the price and the indicators taking different directions, the path each one takes matters.
Tip 4. Confirm with other indicators
Divergence is a strong indicator, but you can trust only in this to trade. You need to combine with other signals to be sure that your interpretation is correct.
How does this happen?
One of the most useful indicators to confirm is reverse and support level. It is also one of the most popular and simple, so you shouldn’t have a problem finding the levels.
How to prevent the fault?
The best way of avoiding false trading signals is to wait for the first candle in the direction of our guess. Once that first candle appears, we enter the position.
Tip 5. Set up the trade
The last step is to set up the trade. After making all the previous steps, you need to set the trade.
How does this happen?
After the first candle in your direction appears, enter the trade and set up your stop-loss and take profit level.
The stop-loss and take profit should be established around the closest support and resistance level you can find.
How to prevent the fault?
By not setting those levels, you are risking more than you should. Set the stop-loss to avoid losing more than you can afford, and then take profit to look at your earnings.


Comments