

A lot of times, you get confused with technical indicators. The more indicators you put, the more clutter you get.
Indicators are significant for technical analysis, but you can’t rely entirely on them. You can use them to predict the market’s direction, but you can’t see them as a holy grail.
So, how can you trade without them? The short answer is through naked trading. The long answer, we’ll discuss in this guide.
What is naked forex?
It is all about what you can see on the candlestick charts and then make your trading decisions. Unfortunately, technical indicators only predict past price movements, so naked traders neglect the idea of using any technical indicator.
For naked trading, you must understand the concept of price action. By learning it, you can identify market movements and predict future price moves.
A keynote to add here is to understand different candlestick and chart patterns before applying naked trading. Why, you may be asking? Because you won’t be trading with indicators, so candlestick patterns are your only choice.
Another important point you should note is to identify market cycles. You see the financial market, especially the forex market, move in cycles. So the trend you see today may have occurred in the past.
For instance, when the NFP is released, USD can behave in a certain way than it did before. So by grasping market cycles, you can make your move.
Although naked trading is a type of technical analysis, you should also use fundamental analysis to get the complete market picture.
Tips to increase your trading success without using indicators
Now that you know what naked trading is, let’s make some cool bucks without using indicators.
1. Understand trendlines
Trendlines are one of the important forms of technical analysis that provide many valuable trading opportunities. The basis of the trendline is to ride the trend. This means you need to take positions based on the direction of the trendline.
You can plot the trendline between two or more points on a chart. The direction of the trendline signifies the overall movement of the trend. Let’s illustrate this with an example:
If EUR/USD is trading at $1.2254 and moves to $1.2130 in a week and $1.2094 in two weeks, you can draw the trendline between these three points, starting at 1.2254, then to 1.2130, and then towards 1.2094. Thus, you can see on the chart that there is a downtrend, and after identifying it, you can take short positions.
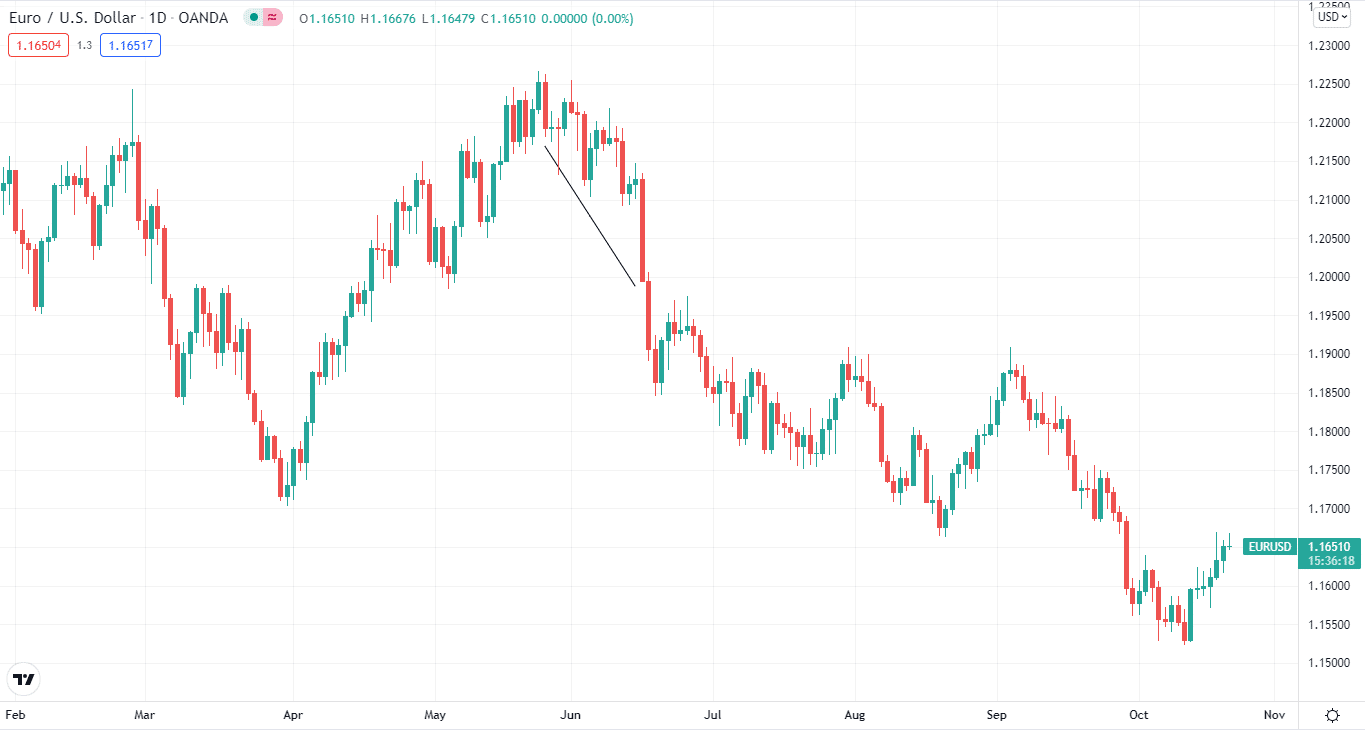
EUR/USD price chart
How does this happen?
The price creates higher highs and higher lows during an uptrend. However, the uptrend is not over if the price drops marginally below the trendline while maintaining higher highs and lows. The ascending trendline is another name for this.
In a downtrend, on the other hand, the price makes lower lows and lower highs. It’s a falling trendline if the price rises above it and the lows and highs are lower. It doesn’t mean the downtrend is over.
How to prevent the fault?
You can prevent the fault by creating higher highs/lows and lower highs/lows on the chart.
2. Locate chart patterns
Chart patterns are the basis of naked trading. You can’t make money from naked trading if you don’t recognize different chart patterns. Chart patterns come in two types; reversal and continuation. Reversal patterns suggest trend reversal, while continuation patterns mark trend continuation.
The two most important patterns that you need to recognize are:
Head and shoulders pattern
It is a common form of pattern that appears regularly on the chart.
It is made up of two shoulders with the head sandwiched between them. Lower highs are represented by the shoulders, whereas the head represents greater highs.
This pattern is often a reversal pattern that signals the conclusion of an uptrend. In addition, if the pattern appears during a downturn, it indicates an upward trend.
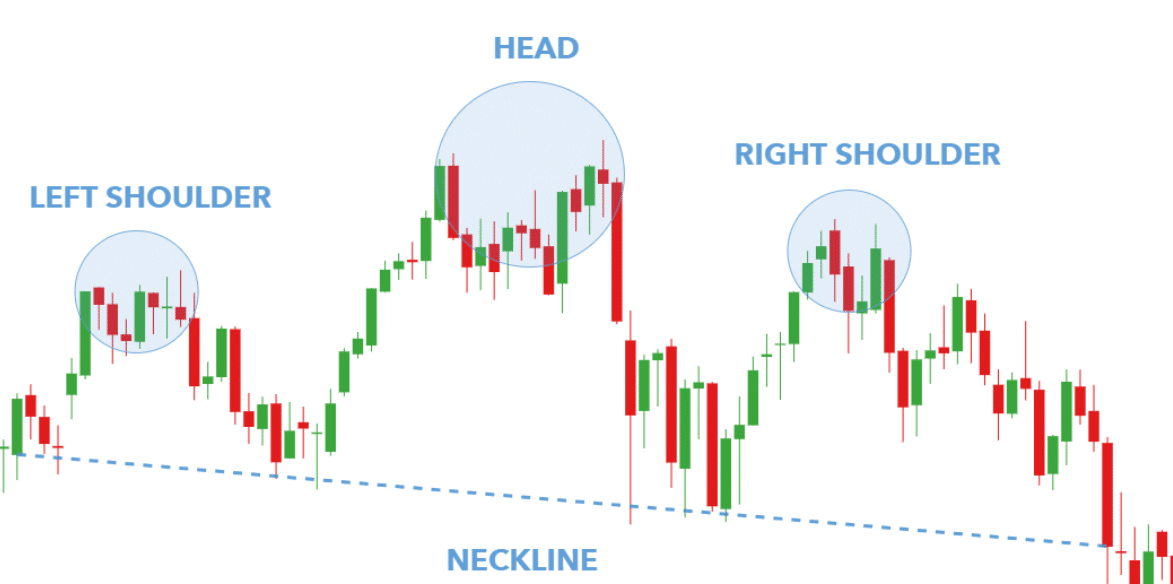
Head and shoulder pattern
Wedge pattern
It might indicate a price reversal in either direction. Converging trendlines, falling volume, and a breakout from one of the trendlines are the three major traits to look for when identifying the pattern.
The falling and rising wedges are the two forms of wedge patterns. A negative reversal pattern that happens in an upswing is the falling wedge. On the flip side, the rising wedge is a bullish reversal pattern.
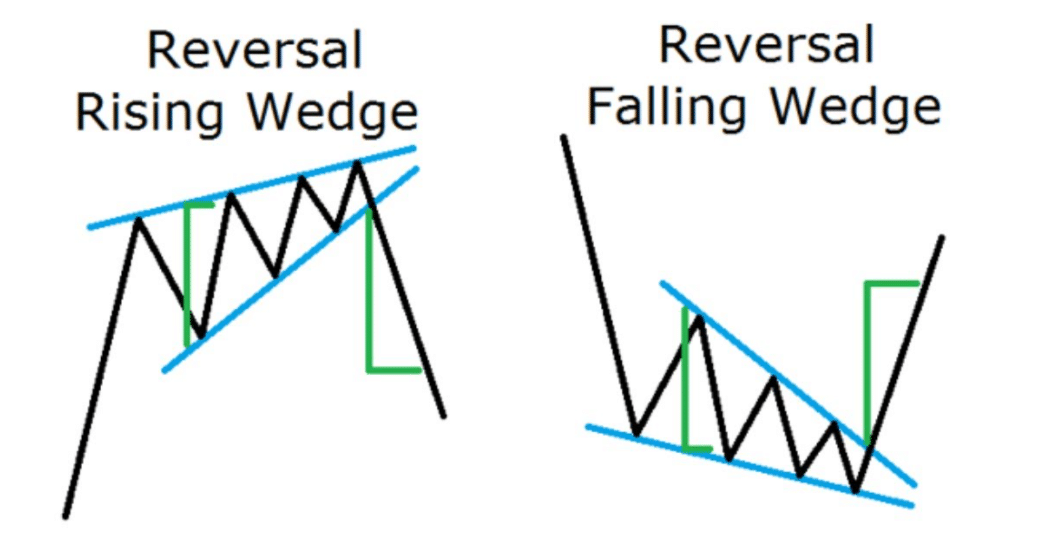
Wedge pattern
How does this happen?
Price makes a pattern, either reversal or continuation. As mentioned above, the price moves in cycles. Within these cycles, there are small cycles. It can be a reversal or continuation cycle.
How to prevent the fault?
As a naked trader, you need to recognize continuation and reversal patterns to trade accordingly.
3. Navigate candlestick patterns
Candlestick patterns feature many candles of various colors and sizes, each of which tells a different story. For example, a bullish candle is traditionally green or white, whereas a bearish candle is red or black.
Although there are various candlestick patterns, here we’ll discuss two of the most important candlestick patterns. They are hammer and engulfed.
Engulfing
The engulfing pattern comprises a long candle with three smaller candles. The longer candle engulfs the smaller ones.
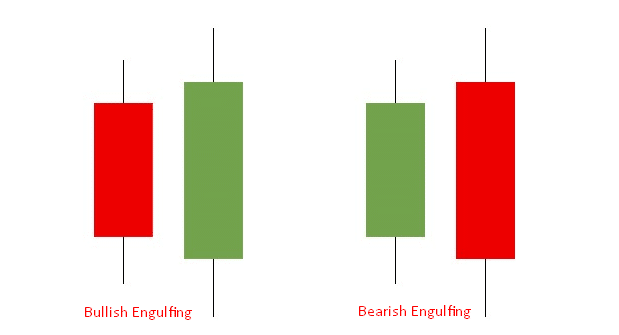
Engulfing patterns
Hammer
It illustrates a small body with a small wick on one end and a larger wick on the other.
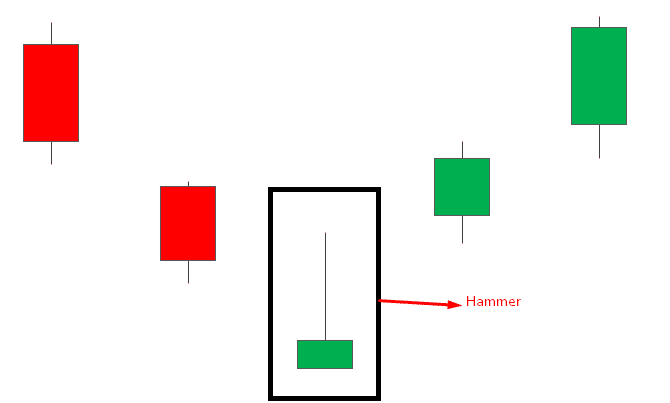
Hammer pattern
How does this happen?
The candlestick chart is one of the most accurate charts in forex trading. It depicts certain candlesticks that can tell you about market momentum.
How to prevent the fault?
You can identify these candlestick patterns and take your buy or sell positions accordingly.
4. Support and resistance
The level that the price does not drop below for an extended period is the support level. Thus, you can draw the support level at the lowest lows for the time frame.
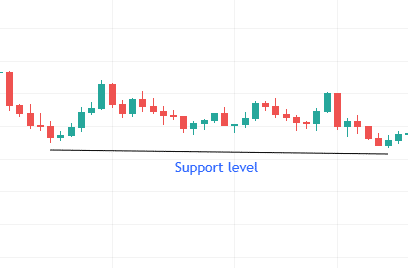
Support on the chart
Resistance is the price level at which price stays at the top for an extended period. You can plot the resistance line at the highest highs.
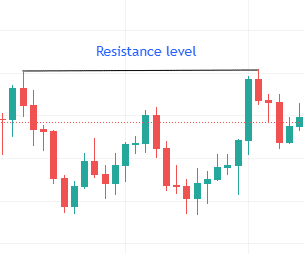
Resistance on the chart
How does this happen?
Price makes peaks and troughs all the time. First, it touches the ceiling then comes towards the floor.
How to prevent the fault?
The basic trading strategy for employing support and resistance is to buy near support in uptrends and sell or short near resistance in downtrends.
5. Follow the price action
This is the simplest form of naked trading. Following the price, action means that you follow the course of price on the chart. For instance, as you can see on the chart below, you take a buy position when the price is heading north.
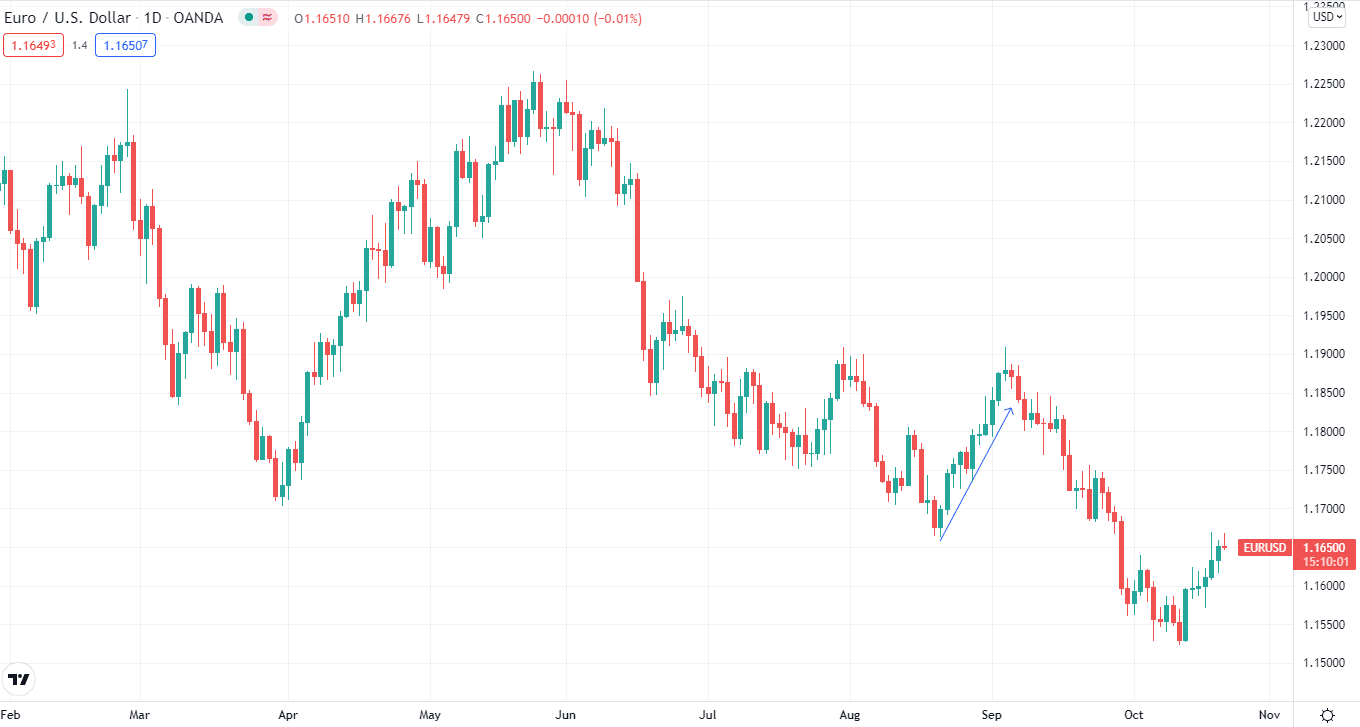
Price action example
Even though the strategy is simple, we don’t know where the market will move next, so a price action approach can be risky.
How does this happen?
Price moves in a certain direction. It can climb up or down. So, you have to identify the course of price action.
How to prevent the fault?
You can look at the chart and predict where the price is heading next.
Final thoughts
Naked trading clears the noise and presents you with a clear picture. It is a good trading technique to get started in trading. However, you must combine technical and fundamental analysis for naked trading to work and not rely 100% on technical analysis.


Comments