

Regardless of your trading style, you are likely using one or two moving averages in your trading. However, there are too many versions of this indicator to date. Which one should you use? While you can use the popular versions like EMA, SMA, SMA, and WMA, a newcomer is making some noise. That is the hull moving average.
Alan Hull introduced the HMA in 2005. The goal was to reduce lag in moving averages. If you compare it with SMA and EMA, HMA looks smoother and stays closer to price. To some degree, HMA can address the problem of lag and smoothness of moving averages.
Is HMA the best moving average then? Maybe not. No specific MA version or period is best. However, HMA offers a feature not seen in other averages. You may find it the best average if it helps with your trading.
Let us dig deeper into HMA in this post and learn how best to trade with it. You will know how it differs from other main types of averages and its benefits to users.
What is the hull moving average?
HMA, like any moving average, is a trend identifier. Once plotted on your chart, it appears as a curved line that goes up and down while interacting with the price. HMA, of course, varies from other MA versions due to its unique calculation. As will be presented shortly, HMA significantly differs from SMA and EMA regarding smoothness and reaction to price movement.
This remarkable attribute of HMA is worth mentioning here. You must have realized that smoothness and quick response do not go hand in hand most of the time. Some traders use averages of the same type but of different periods to address this dilemma. HMA seems to have provided a solution to this predicament with only one average.
Difference between HMA, SMA, and EMA
HMA versus SMA and EMA
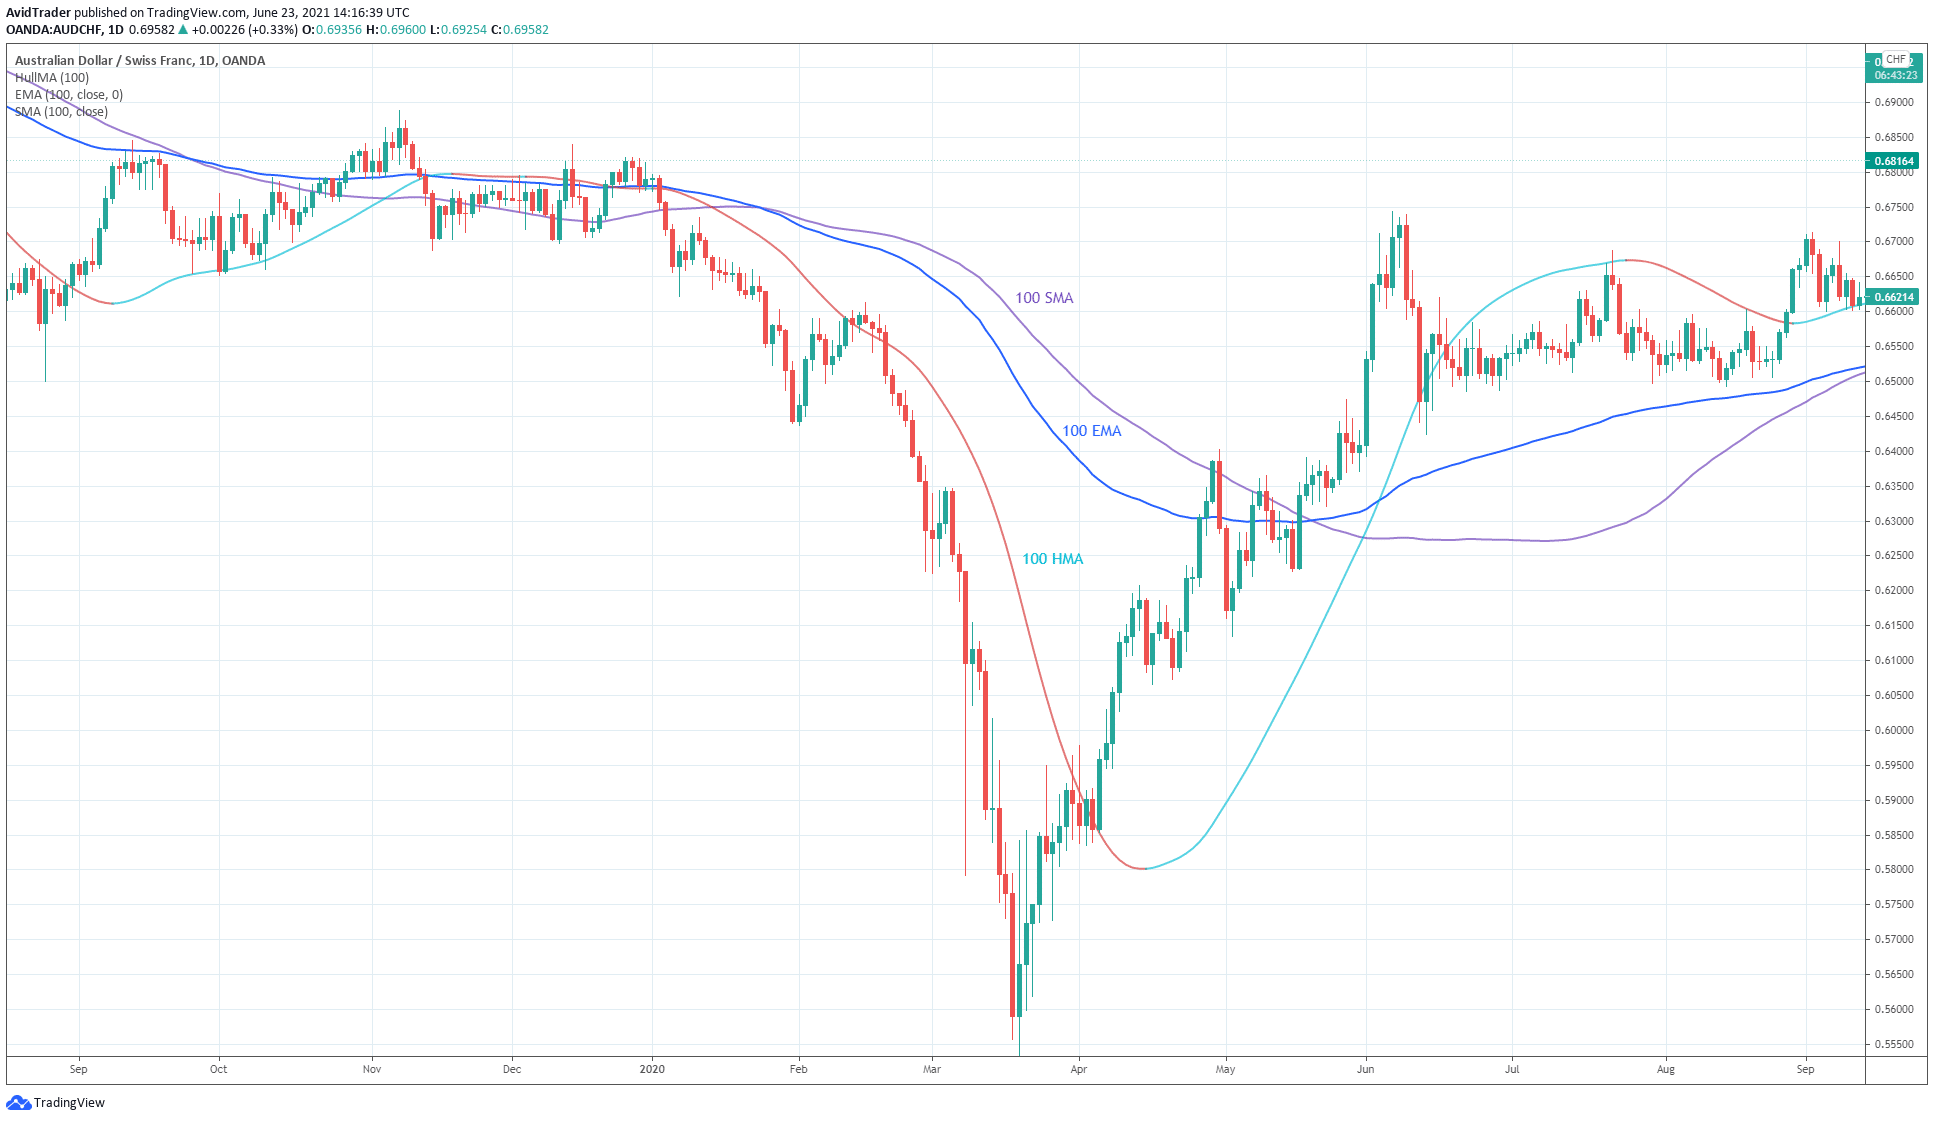
The AUD/CHF daily chart above clearly shows the difference between HMA, EMA, and SMA. We utilize the same length or period for the averages (i.e., 100) to make the comparison clear-cut. As you might expect, EMA is more active than SMA, but HMA is way more dynamic and responsive to price than both. HMA touches more swing points than SMA or EMA.
When the market moves sideways, all three averages are flat. The price oscillates up and down around the averages. This suggests that averages have limited use in sideways markets regardless of type. When the market gets out of consolidation, the averages start to separate.
HMA picks up the signals much more quickly during trend reversals than the other two. The slow reaction of SMA and EMA is evident in this chart.
HMA color coding
Benefits of using HMA
HMA has two fantastic attributes.
First, it tells you how close or far the price is from the average. HMA has excellent angles and is never flat as long as the market is trending. All averages share this characteristic, though. However, HMA gives a qualitative measure of trend. By looking at the HMA angle, you can tell if the trend is strong or weak.
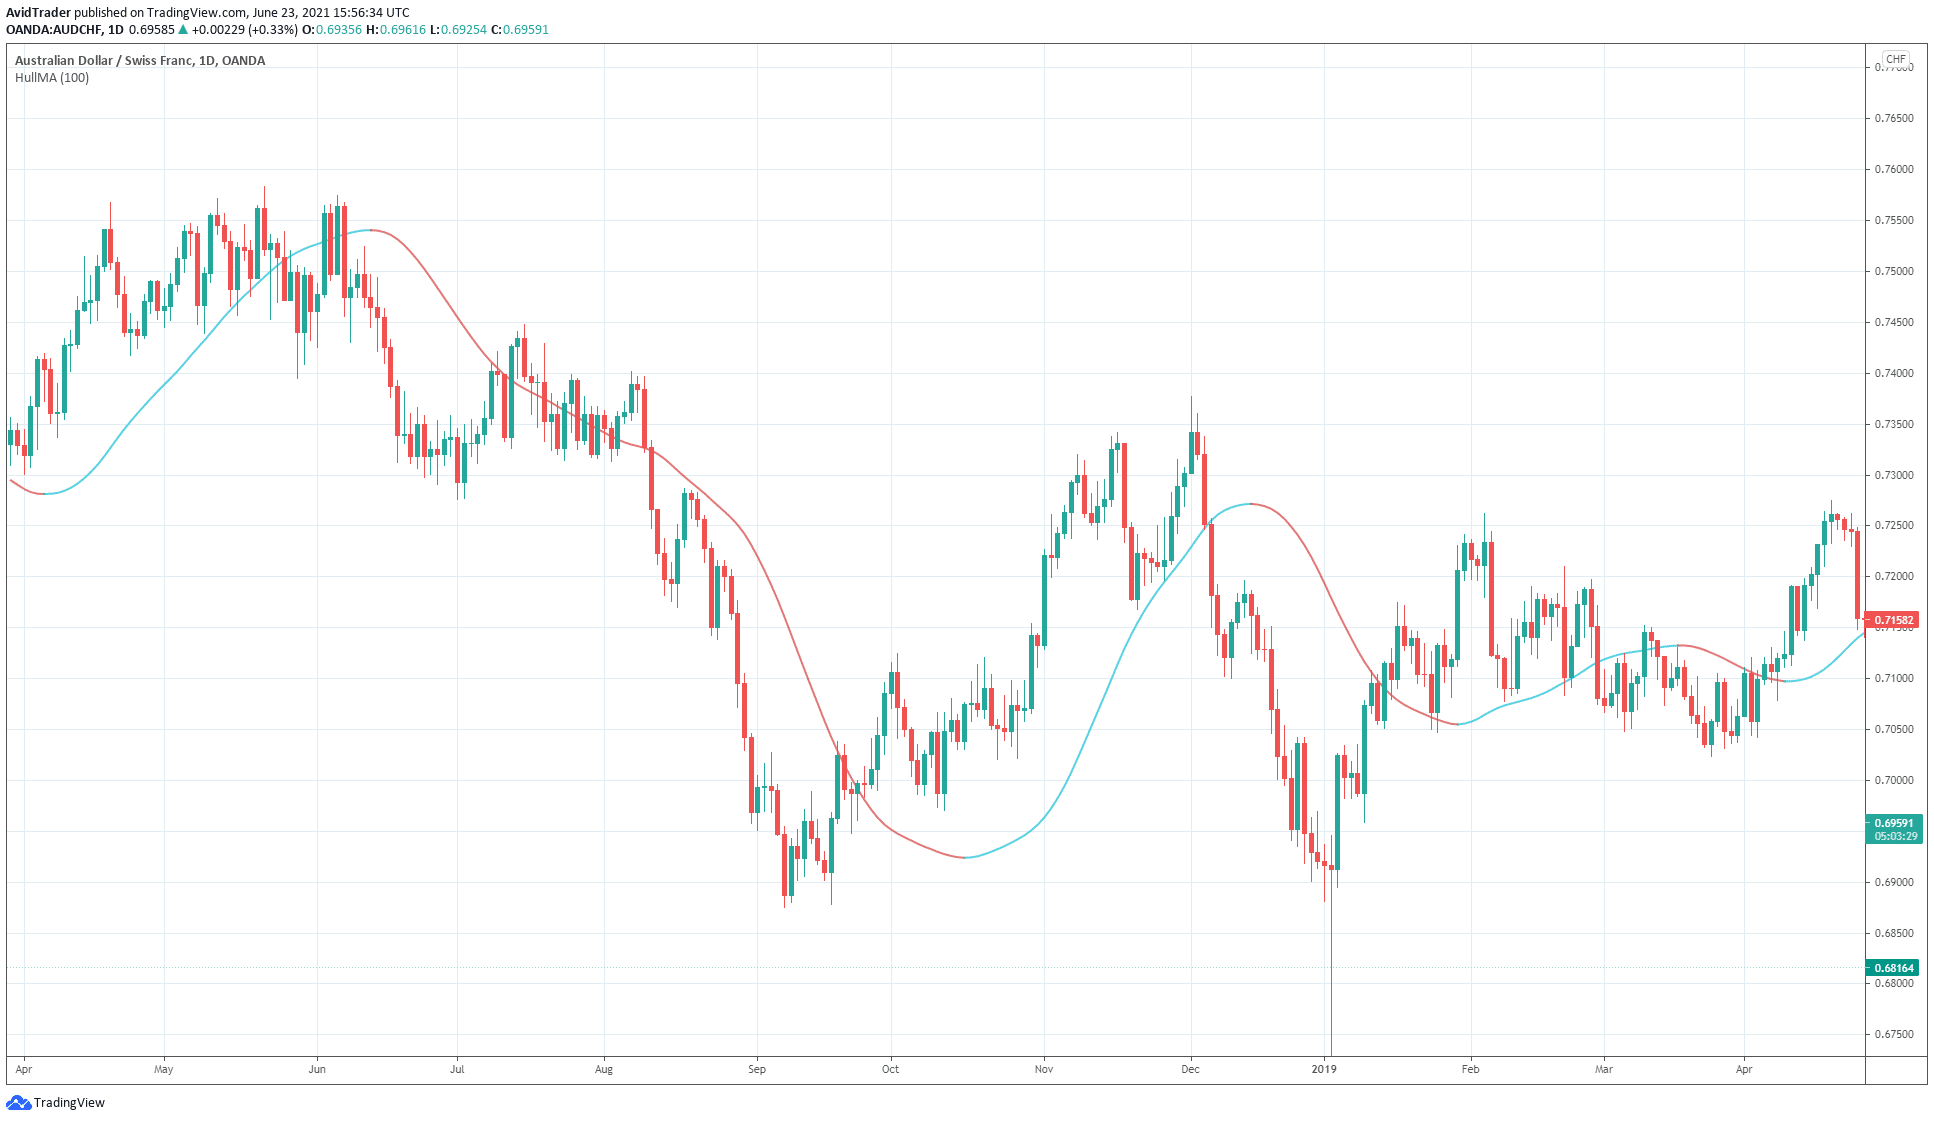
What traders love about HMA is the color scheme. The creator built this color coding into the program right from the start.
- If the market is bullish, the HMA line is shown in blue.
- If the market is bearish, HMA is shown in red.
On a few occasions, the slope of an average is hard to perceive. This normally happens when the market is transitioning from ranging to trending or vice versa. This is no longer a problem with HMA because you can quickly look at the HMA color and figure out the trend. Refer to the chart above.
Which HMA period is best?
Like any moving average, the HMA period is adjustable. You can adjust the period in the inputs or settings. The indicator gets new values and displays a slightly different line when you do this. Short periods will lead to the display of steep lines with great sensitivity to price movements. Longer periods will show a less steep line and less reactive to price changes.
There is no single answer to this question if you want to know the best HMA period. The best period depends on your specific strategy. The only way to find out is through trial and error. Check your charts and go back to recent history. Strike a balance between the number of signals and the accuracy of those signals.
HMA combination
How to use HMA in trading?
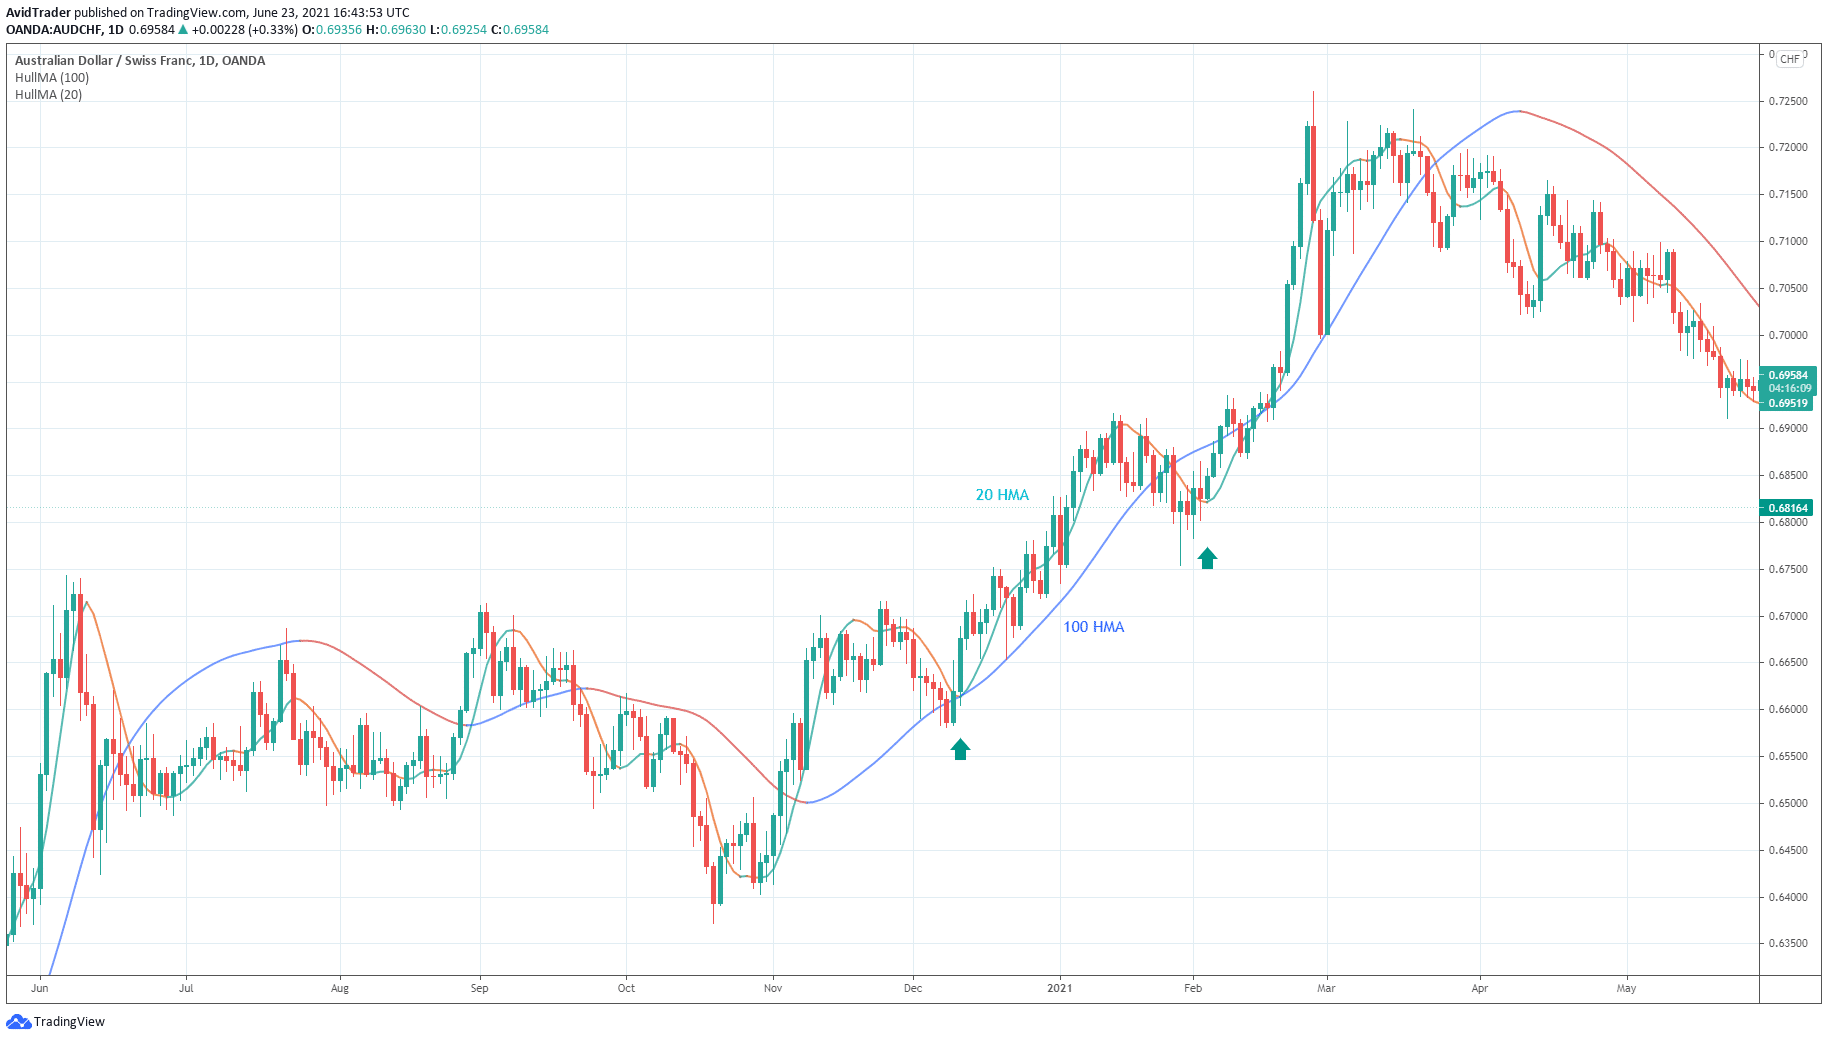
One way to trade with HMA is to employ multiple instances with different periods. Two HMAs with different periods is a good start. While one HMA has a longer length, the other HMA can be shorter. Your primary trade identifier is the long-period HMA. If it is inclined upward, the market sentiment is bullish, and if it is inclined downward, it is bearish. Trade whatever sentiment the market assumes at any given time.
Meanwhile, your main entry trigger is the short-term HMA. However, this HMA should conform to the signal of the long-term HMA. You can get optimal entries when the market corrects. There are two such scenarios on the chart above.
The easiest way to trade with an HMA combo is via color-coding. This chart plots the 100 HMA and 20 HMA. Just wait for the two HMAs to have the same color. It would help to wait until 20 HMA turns green in the instances marked above because 100 HMA is moving up.
Final thoughts
As covered in this post, HMA is an exciting trading tool. Although it reacts quickly to price fluctuations, it can keep the smoothness to a reasonable degree. This allows you to enter trades early without losing the overall trend. When the trend is changing, you can quickly exit the position. If there is one weakness of the HMA, that is the overshoot of the line. This often happens when the trend and directional change are steep and abrupt. It may not be much of a shortcoming, though.


Comments