Making long investments is not the only way to profit from stocks. Scalping stocks can give you profit every day if you learn how to trade stocks correctly. Unfortunately, every stock market investor dreams of getting rich by purchasing penny stocks just before they explode. The truth is that the chances of that happening are small.
Scalping stocks is based on the principle that small movements in price happen every minute while long trends are hard to find. Therefore, this set of techniques focused on the normal price fluctuation can make you earn money every day. Keep reading to learn the best three scalping techniques and apply them properly in the stock market.
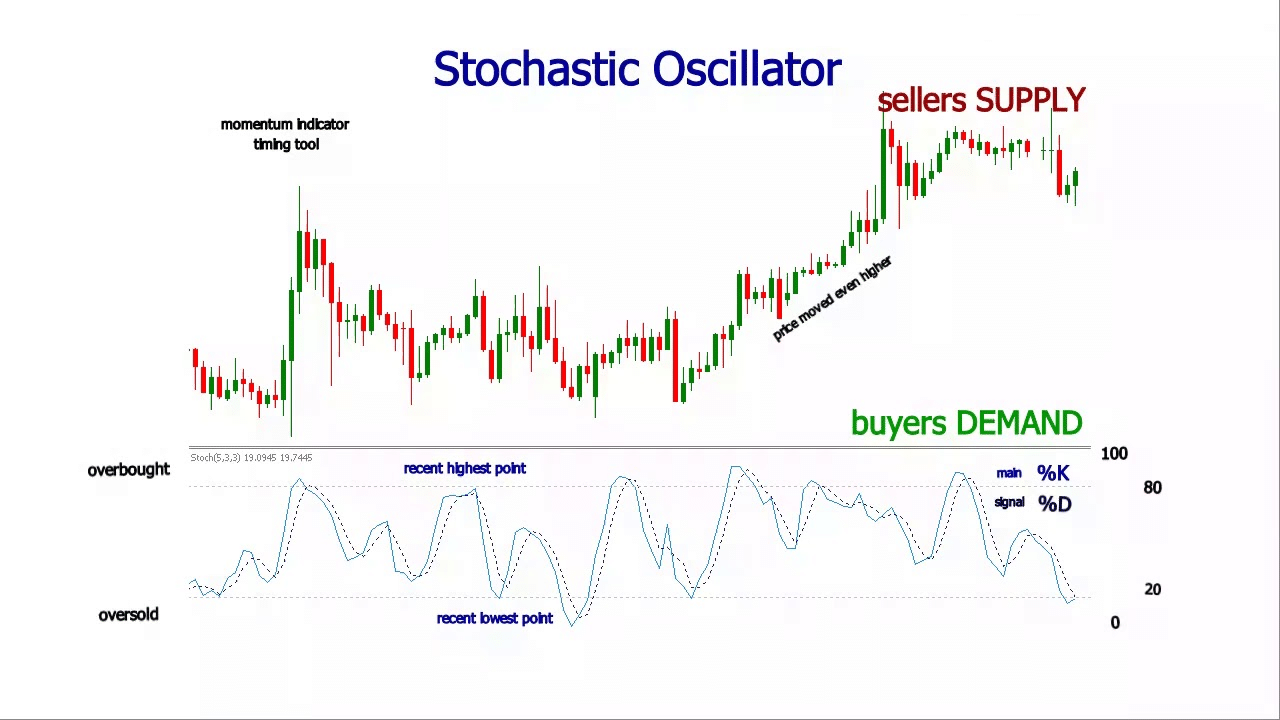
Strategy 1. Stochastic oscillator strategy
It is a momentum indicator that reflects the feeling of the market to the current price of the assets. It consists of a range that goes from 0 to 100 and compares the current closing price with the closing prices of a determined period.
How does it work?
In this strategy, the trader bases his action on what the stochastic oscillator indicates. Besides a range, this indicator also has two lines along with the indicator that can be used as entry and exit points. Those lines are called %K and %D. %K is a black line in most stochastic oscillators, and %D is a red line. Of course, this could change according to the broker’s interface and the user’s preference.
How to start?
Unless you want to make advance trading like entering a short position, the common way of trading stocks is to buy before the price increases. Therefore, we want to look for indicators that tell us the price is about to rise. For that, we need to pay attention to two things.
The first thing is the oscillator level concerning the range. A price increase will occur when the oscillator reaches a level below 20%.
But wait, we still need confirmation. Once the indicator level is below 20%, you want the %K line to cross above the %D line.
The trade ends when the %D line crosses above the %K line again.
How to manage risk?
Like in any other trade, you want to make as much profit as you can, but when your scalp is a lot more critical to preserve your wins. One significant loss can erase many small profits.
Stop-loss orders can be used at appropriate points to protect trades, but you should also exit the trade at the first sign of reversal.
Many traders wait to see the %D line crossing above the %K line, but we recommend you exit the trade as soon as the indicator level is above 80%, even if the lines haven’t crossed.
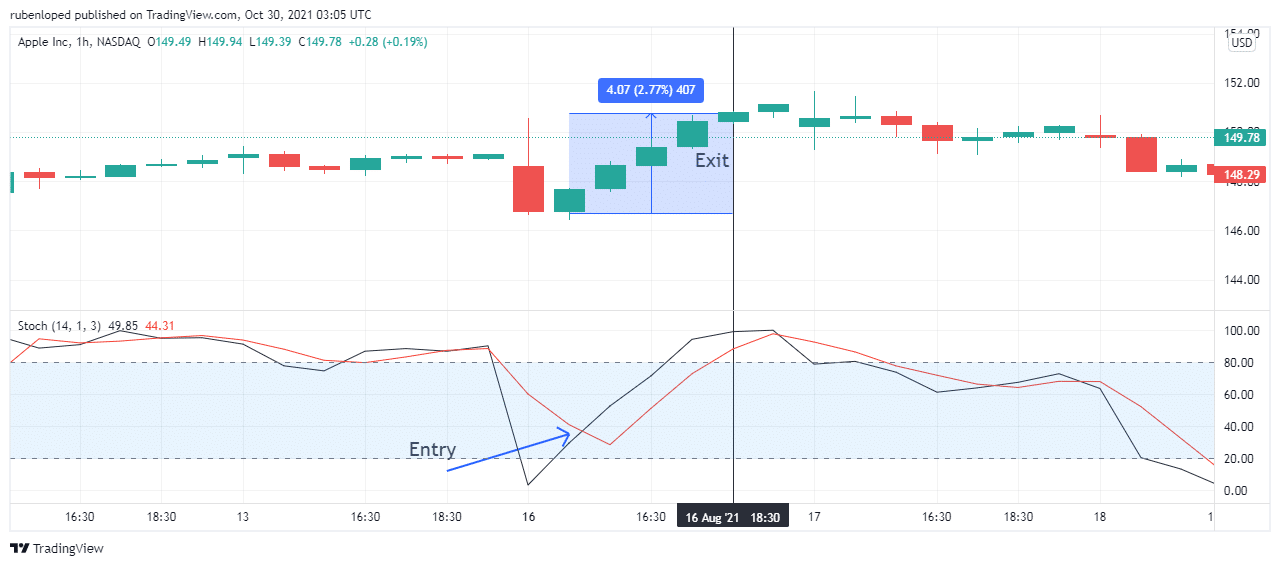
The price of the stock increased 2.77%
In the example above, we entered the position to buy some Apple stocks when the %K line reached levels below 20% and after it crossed above the %D line. Four hours later, when both the %K line and the %D line were above the 80%, we exited the trade with a 407 points profit. Even when the trend continued for another hour, by exiting the position early, we still got most of the profit and locked our earnings,
Strategy 2. Simple moving average
The simple moving average line takes the average of the last closing prices and draws a line in the same price chart. There are many common periods used to calculate the simple moving average (SMA). The long periods SMA draws long-term trends, and the shorter periods are closer to the current price.
SMA crossover forex strategy
How does it work?
For this technique, you want to use three different SMA with different periods. The first is a 200-period SMA to draw a long-term trend. The other two use shorter periods, and those are the ones that will give us the entry and exit points. So, the other SMA are the 20 periods SMA and the 5 periods SMA.
How to start?
You set the indicator in the chart of your broker platform and select the 200, 20, and 5-periods SMA. For this strategy to function as a scalping strategy, the period should be between 5 and 20 minutes.
Now, you pay attention to the long-term SMA, that is, the 200-periods SMA. This SMA is the one that will tell us where the trend is going. Again, to keep it simple, we want the long trend to go up to avoid short positions.
Then, we enter the trade once the 5-period SMA crosses above the 20 periods SMA. If the lines cross again, so the 5-period SMA is below the 20-periods SMA, we exit the trade.
How to manage risk?
Since we are looking for small profits, the risk/reward ratio won’t be as good as in other ways of trading. Looking for a 1:1 risk-reward ratio is good for scalping.
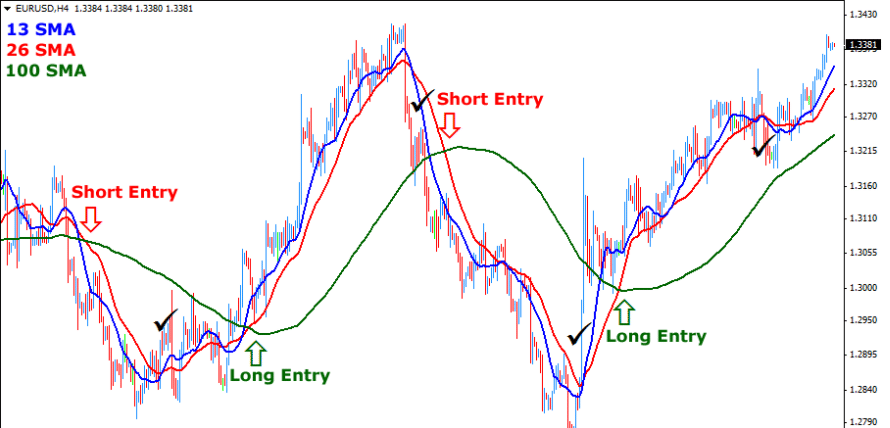
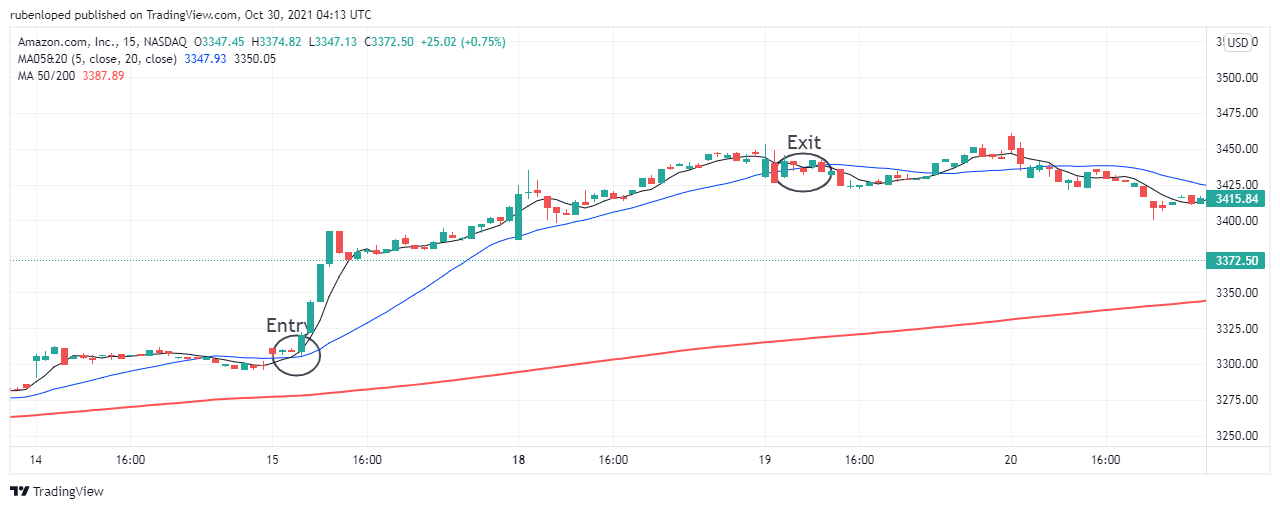
The uptrend ended after the SMA crossed again
In the example, the black line is the 5-periods SMA, the red line is the 200-periods SMA, and the blue line is the 20-periods SMA.
Since the 200-period SMA indicates an uptrend when the black line crosses above the blue line, you want to enter a long position. The position ends when the blue line of 20-periods SMA crosses above the 5-period again.
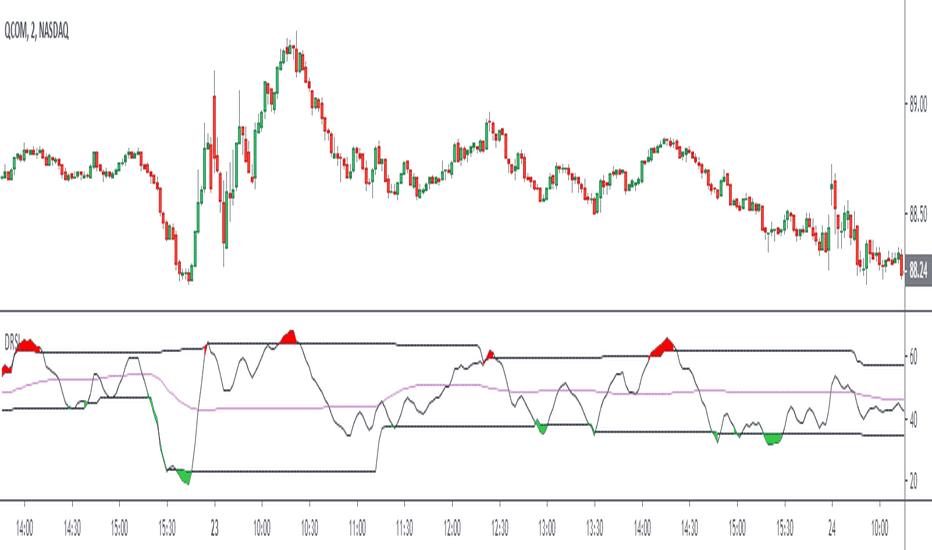
Strategy 3. RSI strategy
The RSI indicator is one of the favorites for its simplicity. It is also a momentum indicator that tells us where the price is and how strong the movement is. It compares the impulse of the bullish and the bearish forces to predict whether a trend is strong or if it is about to reverse.
RSI indicator
How does it work?
This indicator is similar to the stochastic oscillator in appearance, but the difference is that with RSI, you don’t have to look for any lines to cross. Instead, there is just one level you have to pay attention to.
How to start?
The indicator has two relevant levels. Those levels indicate the entry and exit points.
The first one is 20%. Once the indicator is below that level, you should expect an uptrend. The trade ends once the RSI indicates a level close to or above 80%.
How to manage risk?
It is common to use the RSI combined with other kinds of indicators for confirmation. For example, using SMA confirms the long-term trend.
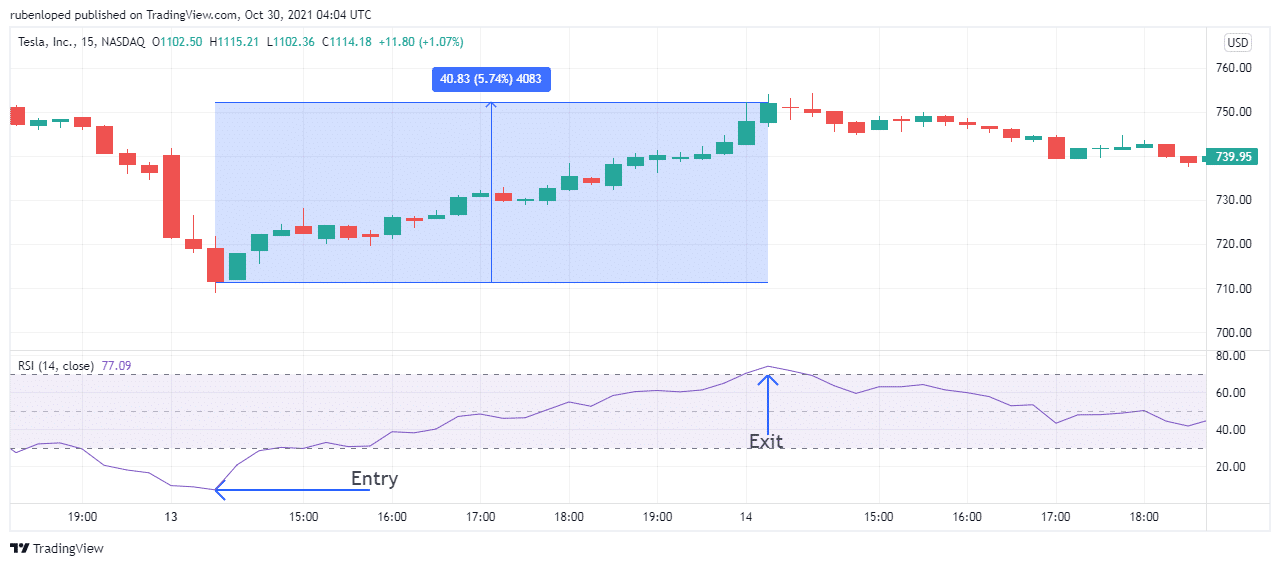
However, the trend sometimes reverses before reaching 80%. That retracement could erase your earnings quickly. To avoid that, and since there is no other sign in the indicator to exit the trade, it’s a good idea to set a trailing stop with the RSI.
The RSI indicator
You can see that we exited the trade once the indicator crossed the 80% mark in the example above. Of course, sometimes the trend keeps rising over 80%, but given the nature of scalping, it is better to lock the small earnings instead of losing even one time.


Comments