
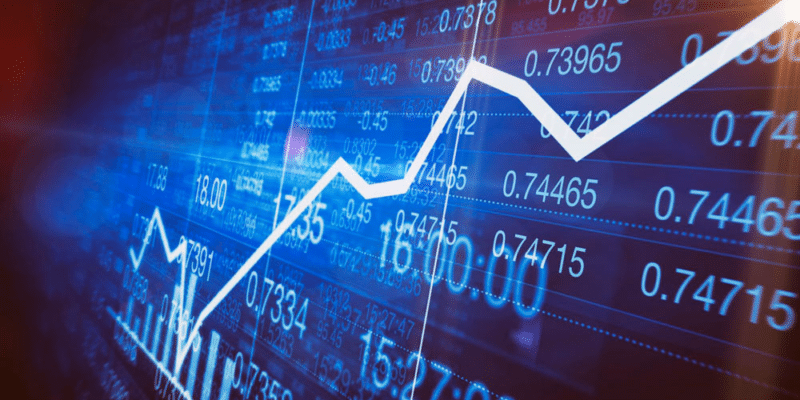
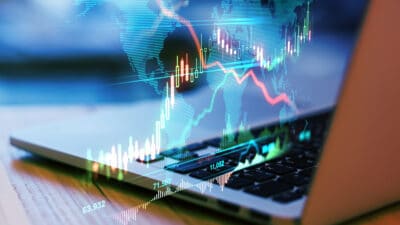
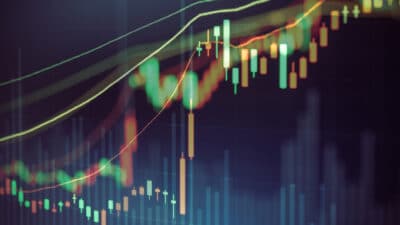
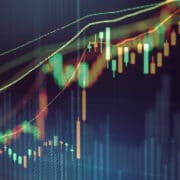
Although candlestick analysis has become very common these days, it wasn’t very popular until 1990. Back in the 18th century, traders used it to forecast the prices of rice in Japan. Presently, it has become the most widespread way of charting in crypto trading.
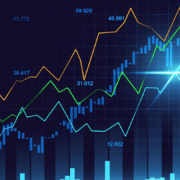
The candlestick chart displays time across the horizontal axis, and the vertical axis presents price figures. Unlike other chart types, including line and bar charts, candlestick contains more detail that helps forecast.
The candlestick chart displays the high and low prices for a particular asset, along with the daily opening and closing prices. Let’s go over the candlestick’s fundamental anatomy and a few significant patterns you should know as a cryptocurrency trader.
What is a candlestick chart?
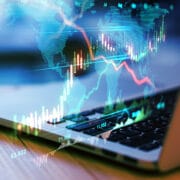
It is being used to display a price variation in the financial trading instruments, including stocks, forex, commodities, and cryptocurrencies. The daily time frame exhibits an intraday movement, and likewise, in a one-month chart, each candlestick displays one month’s price history.
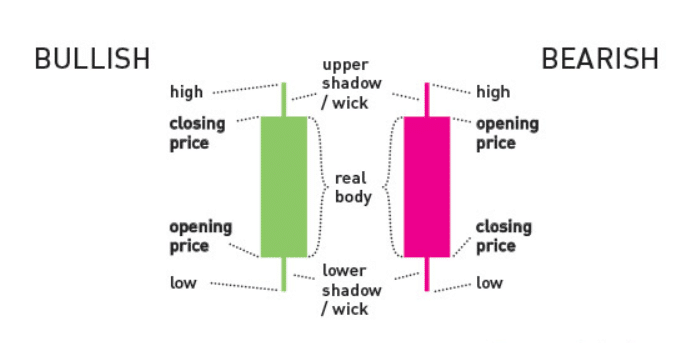
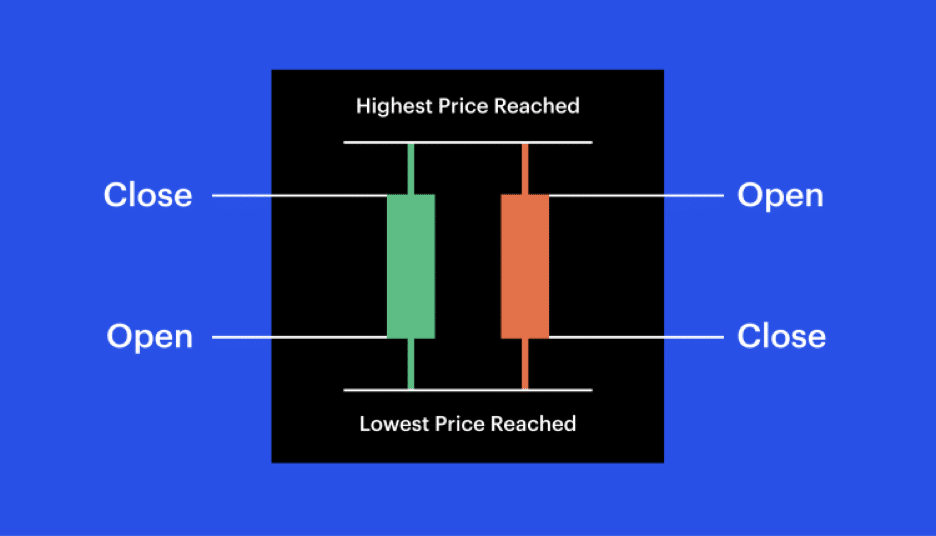
Overall, the candlestick is very similar to the bar chart as both types of charts exhibit the high, low, open, and closing prices for a trading instrument.
The history of Japanese candlesticks
The candlestick was unfolded in the 18th century by a Japanese rice trader whose name is Munehisa Homma. The pattern was presented in the western world by Steve Nison in his book, Japanese Candlestick Charting Techniques. The method was modified with time and adjusted through the ages to become more applicable to current financial markets.
Candlestick has become a staple of every trading platform for almost every financial trading vehicle. It is considered a favorite among traders due to the components’ simplicity and the depth of the information it contains. Analysts and traders also use candlestick analysis to analyze price action and make forecasts for an underlying cryptocurrency.
How to read candlestick charts?
The following section demonstrates the proper way to interpret candlestick charts.
- The green candlesticks exhibit that prices are going up. When the opening price of a particular currency is lower than the closing price, it signals a bullish price movement. Likewise, in an the illustration above, the green candle’s opening price level is near the bottom of a candle while the closing price is holding near the top, showing a buying.
- Red candles show that prices are declining, which means the open level is at the top and the closing level is at the bottom.
These explanations were for beginner traders. Experienced traders can look for patterns to measure market sentiment and also to make predictions about price movements.
In a candlestick analysis, professional traders look for the following indicators:
- A candle with a long wick on the bottom demonstrates that an asset is on its way up. As the price fell for a while, buyers dominated the market, driving prices higher again. It signals a stronger bullish power in the market.
- A long wick on the top of the candle suggests that traders are looking to take profits, which means the market can exhibit a potential sell-off in the future.
- If the body occupies almost all of the candle, with no visible wicks or small wicks on either side, it might indicate a strong bullish sentiment on a green/white candle and strong bearish sentiment on a red/black candle.
How to read one-candle signals?
Short-term traders focus on just one candle and look for one-candle signals that can be very helpful for beginners.
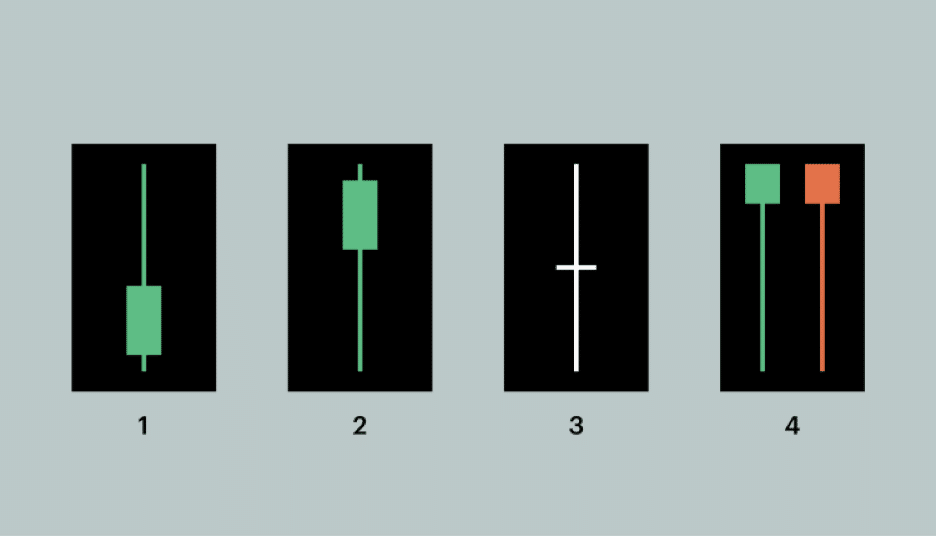
four types of one-candle signals
There are four types of one-candle signals explained below:
- The long upper shadow signifies a bearish/selling trend, which means investors are looking to sell and take profit. The longer the upper shadow, the stronger the indicator.
- The long lower shadow signals a bullish/buying trend, which means investors are looking to buy, driving prices up. The longer the shadow, the more reliable the signal.
- A Doji candle has a small body. It happens when the opening price of a trading instrument is the same or very near to the closing price. Moreover, it suggests indecision and also demonstrates the potential for an upcoming price reversal.
- Umbrella candles are the ones with an extended bottom wick. The red umbrella is a ‘hammer,’ whereas the green umbrella is known as ‘hanging men.’
Final thoughts
In contrast to the simple line charts, candlestick displays a lot more features and is helpful for FX and crypto traders. Despite being one of the most efficient tools, the candlestick encounters several shortcomings when used alone. Thus, candlesticks are mainly applied with other technical tools such as RSI, stochastic, MACD, or moving average.
The candlestick patterns shown above are the most popular, but they are not the only ones. Keep an eye out for a future piece on more advanced patterns.


Comments