
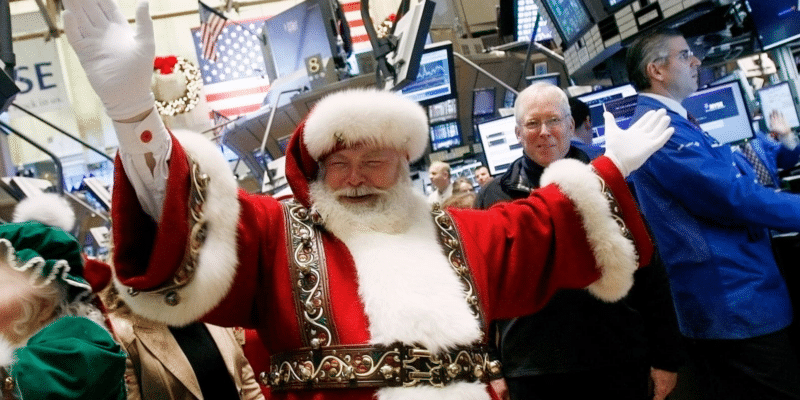
For some reason, stocks deliver gains on the last few days of the year. While this phenomenon does not happen all the time, the regularity is so high that investors look forward to it every year.
Author Yale Hirsch first noticed this phenomenon in 1772 and published it in his book Stock Trader’s Almanac. His analysis showed that since 1950 the S&P 500 rallied by 1.3 percent on average on the last trading week of the year and the first two trading days of the following year.
Does this suggest you should buy the Santa Claus rally too? Why not. On estimate, this phenomenon has failed to materialize on six occasions only since the middle of the 1990s. There is a good chance of seeing it again this year.
In this article, we will dig deeper into this cool stock market phenomenon. Also, we will review three stocks over which Santa Claus seems to have a good influence.
What is the Santa Claus rally?
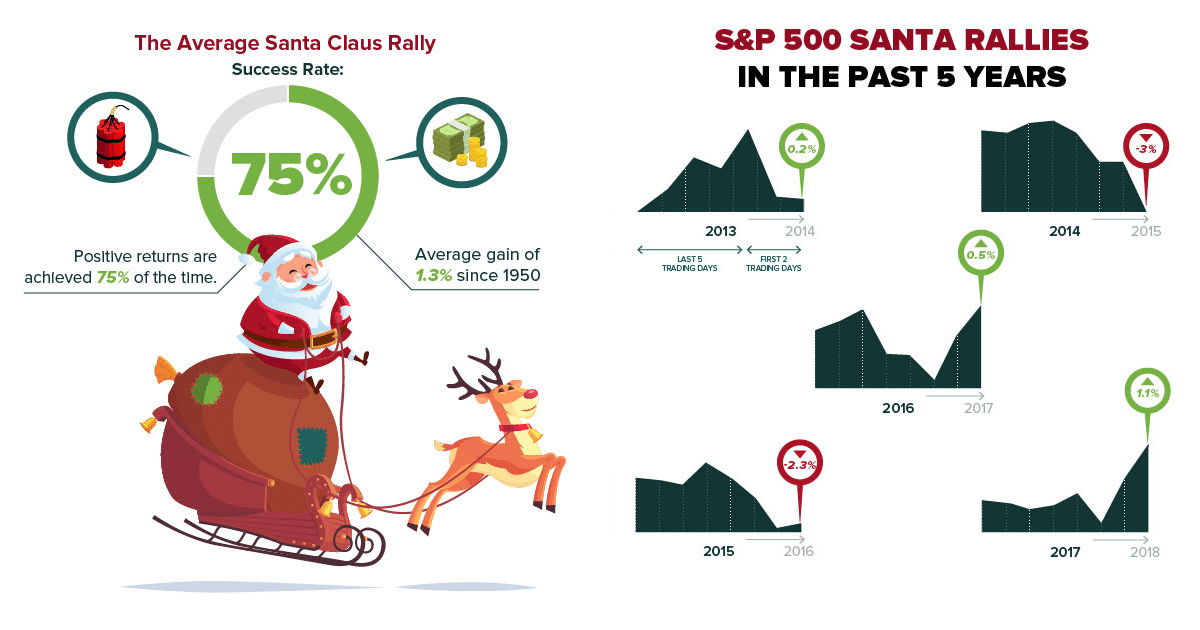
S&P 500, more often than not, turns in about 1.3 percent of gain just after Christmas Eve and shortly after the New Year. This rally is something that investors expect to come every year, and they are seldom disappointed.
Over the last five years, 2018 saw the highest Santa Claus rally. When most investors expect a gain of 1.3 percent, S&P 500 (ticker SPY) surprised them by posting a return of 1.5 percent. This brilliant performance also occurred on the same seven trading days.
When does the Santa Claus rally start?
December is usually a good month for stocks. You can see them gaining value during the yuletide season. However, as already pointed out, the major portion of their growth occurs on the five trading days after Christmas Eve. Therefore, you can expect the Santa Claus rally to begin on December 25, provided that day is a weekday. The safest bet is to take the last trading week of the year and then add the following two trading days.
Knowing this schedule, you can perfectly time your entry and hold your positions until the end of the rally. Usually, when the Santa Claus rally comes to pass, the stocks that took part perform well over a year of trading. Therefore, you can hold your position at least for one year if your stocks perform well before the New Year comes.
What is the Santa Claus rally statistic?
The second-best performing stock during the Santa Claus march is Newmont, a company that manufactures materials. Over the past five years, it posted an average gain of 4.2 percent. This year, the stock has gained 39.1 percent already. The Santa Claus march could only bolster its performance before the year ends.
Top 3 best Santa Claus stocks
No. 1: Apple (AAPL)
Price: $164.52
P/E ratio: 29.14
Market capitalization: $2.682 trillion
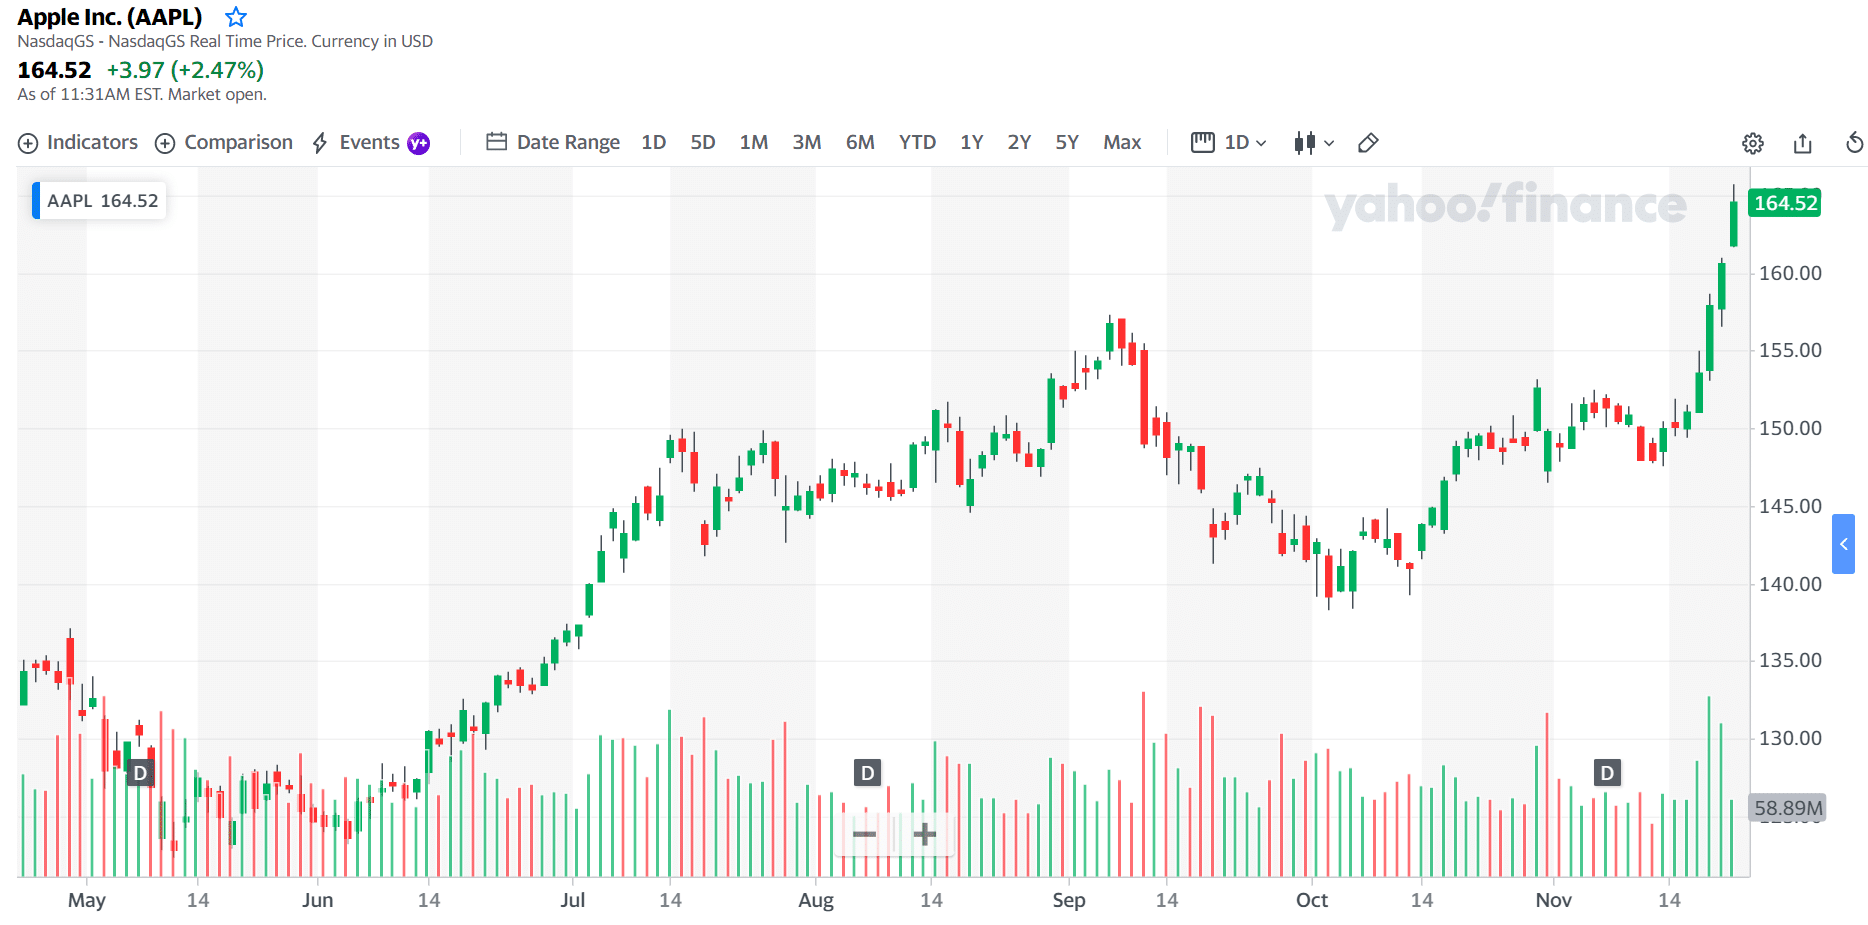
Apple stock price chart
Apple is a manufacturer and seller of computer software and consumer electronic products. In terms of revenue, Apple is the most prominent IT company in America, generating $274.5 billion in income in 2020. It has become the most valuable company in the world from January 2021. Apple ranks at number 4 among the most significant personal computer sellers by 2021 in terms of sales. Concerning smartphone sales, Apple is again top four.
All this allows Apple to take its place among the five biggest IT firms in America. The other names in the list are Google, Amazon, Microsoft, and Meta. The most popular Apple products are Mac laptops and computers, iPhone, Apple Watch, iPad, and Apple TV. The firm also ventures into cloud services, and some of its cloud offerings include Apple TV+, Apple Music, and iCloud.
No. 2: Amazon (AMZN)
Price: $3,618.36
P/E ratio: 70.21
Market capitalization: $1.819 trillion

Amazon stock price chart
Amazon is a powerhouse in the retail industry. Its business focuses on artificial intelligence, digital streaming, cloud computing, and e-commerce. As has been mentioned, Amazon is among the biggest five IT companies in America. It has gained a reputation as being among the world’s most influential brands and as the most valuable brand in the world.
As a retailer, Amazon sells virtually everything, from apparel to electronics to food to toys, and a whole lot more. It also provides services and platforms for music and video streaming, digital document reading, etc. Amazon lately engages in cloud computing that allows companies to build their applications to satisfy an array of business needs.
No. 3: General Electric (GE)
Price: $101.24
P/E ratio: 49.73
Market capitalization: $110.506 billion
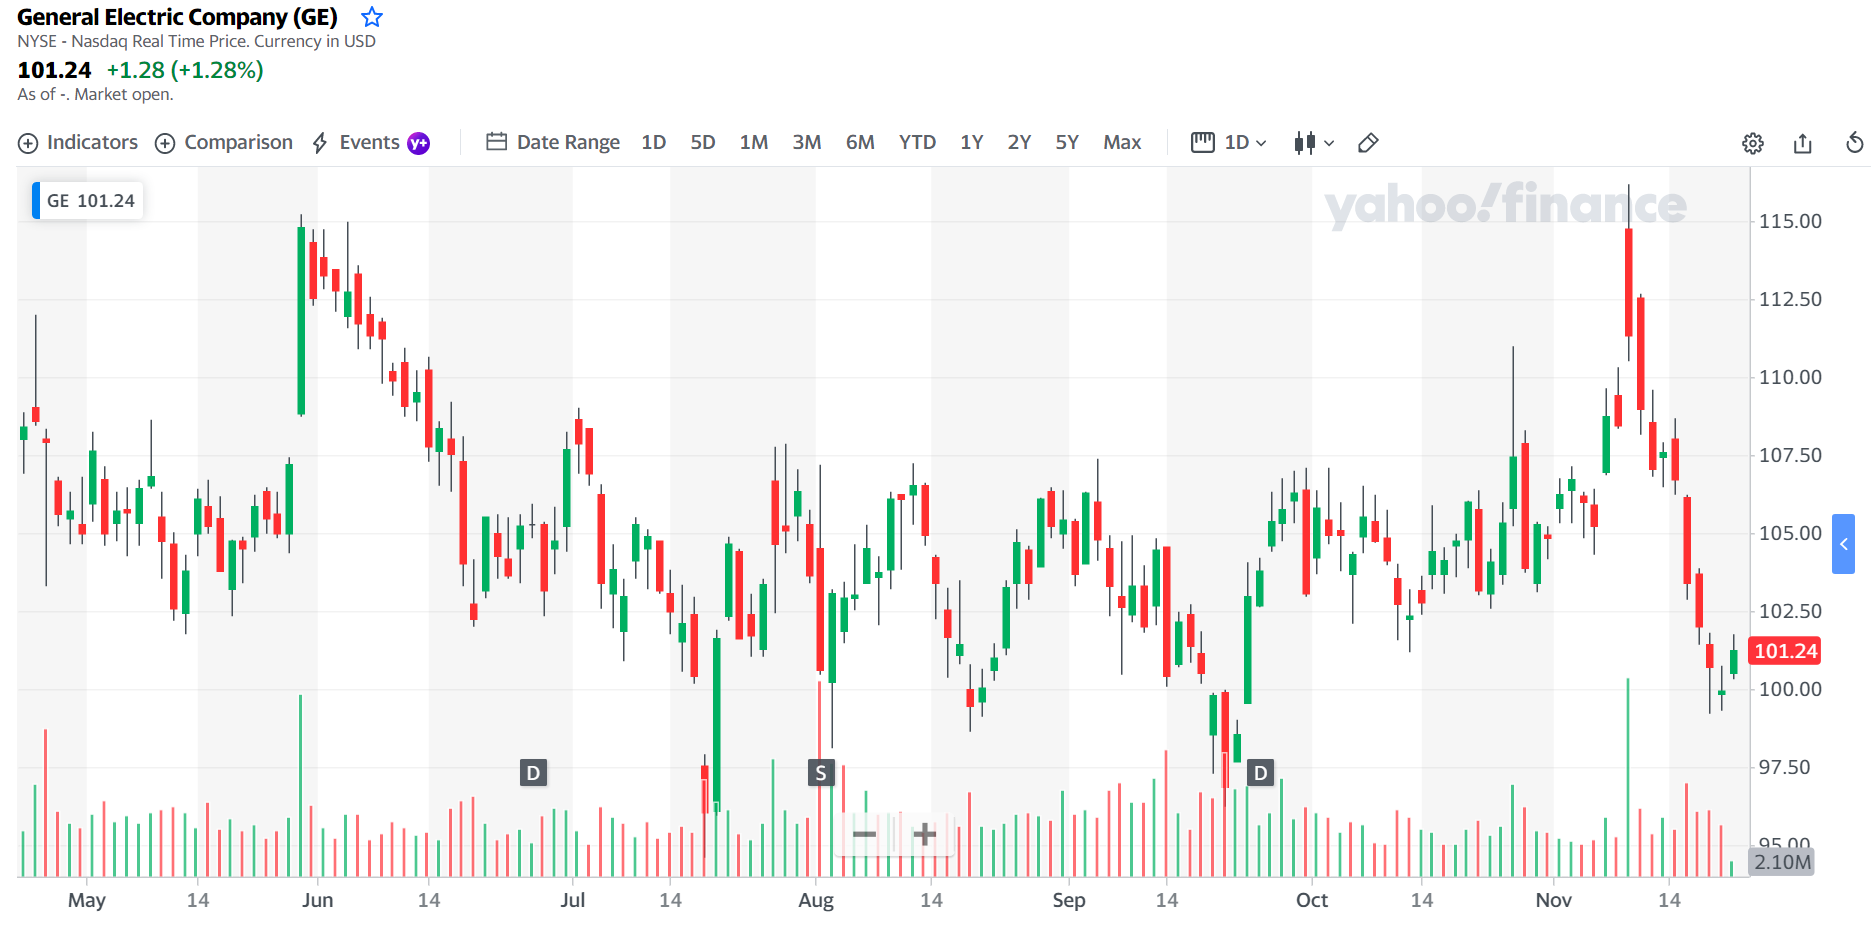
GE stock price chart
Established in New York, General Electric is one of the biggest American companies in the past. Thomas Edison founded the company in 1878, and its headquarters are in Boston. Until 2021, GE has operated in various fields such as power, aviation, digital industry, locomotives, renewable energy, and more. At present, it now focuses operations on the first four fields.
However, GE encountered setbacks in recent times. As a result, in 2018, it was delisted from the Dow Jones index after running for over 100 years. It was among the original components of this index. Now not one of the original members is there. After this, the stock lost value over time. From a peak of $465 in 2000, now it trades around $100.
Final thoughts
Usually, the last week of December sees lower volumes when compared to other trading weeks. Interestingly, stocks can produce significant gains on this week and the two trading days after that. Of course, investors understand that past performance does not guarantee future profits. However, historical data is convincing. It could happen again this year, so keep your eyes open.


Comments