
Defense is a popular topic right now, and these three funds are taking advantage of it. You can come across a market segment that is simply at the right place at the right moment once in a while. Aerospace and defense shares have seen a massive increase in price in the current geopolitical climate.
These corporations provide the power for military and commercial aircraft, defense equipment, and other services targeted toward serving the armed forces.
Market volatility and aggressiveness may be higher in ETFs that track military-related firms because of their narrower investment concentration. As a result, smaller, more tactical holdings are preferable than a larger, more diversified core holding for these products.
Political and military movements throughout the world will have the most significant impact on the direction of these ETFs in the coming years. Although the economic winds are currently in their favor, these funds are still in danger.
What are aerospace and defense ETFs?
They are funds that invest in firms that manufacture and sell aircraft parts and manufacturers of defense-related components and equipment, such as radar systems and missiles.
How to buy an aerospace and defense ETF?
Online brokerage providers offer all of the aerospace and defense ETFs. You may also check out Fidelity, which offers commission-free online trading for all ETFs.
Top five aerospace and defense ETFs buy in 2022
Let us walk you through the leading five Aerospace and Defense ETFs to buy in 2022.
1. SPDR S&P Aerospace & Defense ETF (XAR)
Price: $111.64
Market cap: N/A
XAR is the most recent addition, and it is the most affordable fund. This 2011-launched ETF uses a novel approach to weighing its constituents.
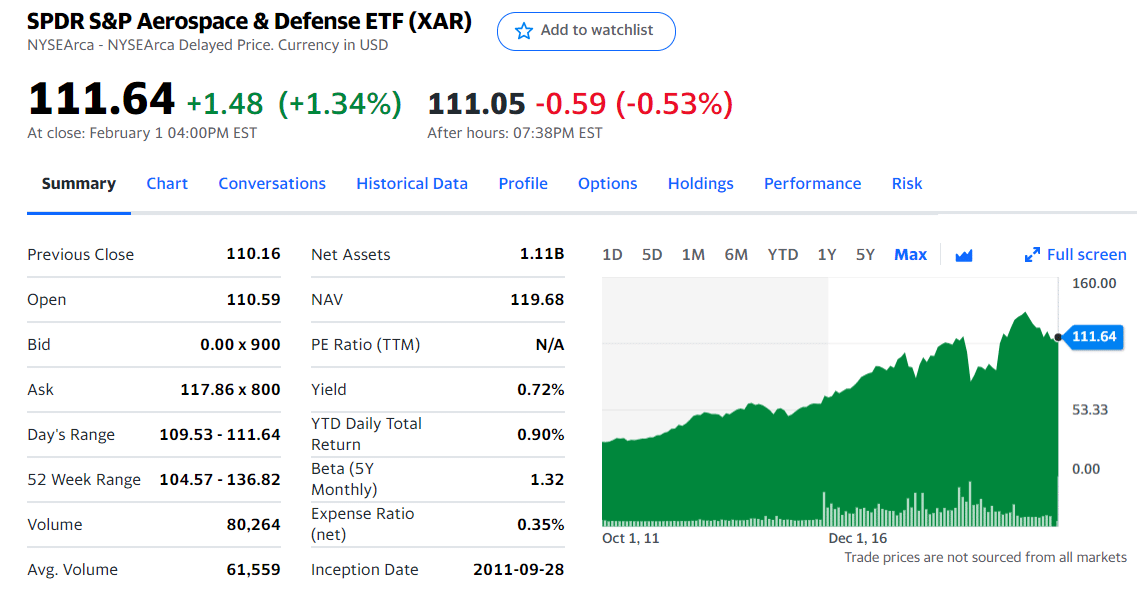
XAR stock summary
The aerospace and military sector of the S&P Total Market Index provides the basis for the index’s 38 underlying holdings, which are distributed equally across the board. As a result, the fund’s assets will be distributed more evenly across smaller businesses, enabling them to substantially impact the fund’s performance. The finding is that Triumph Group Inc. (TGI) and KLX Inc. (KLX), in addition to UTX and GD, are among the top ten stocks held (KLXI). XAR also charges the lowest expense ratio of its peers.
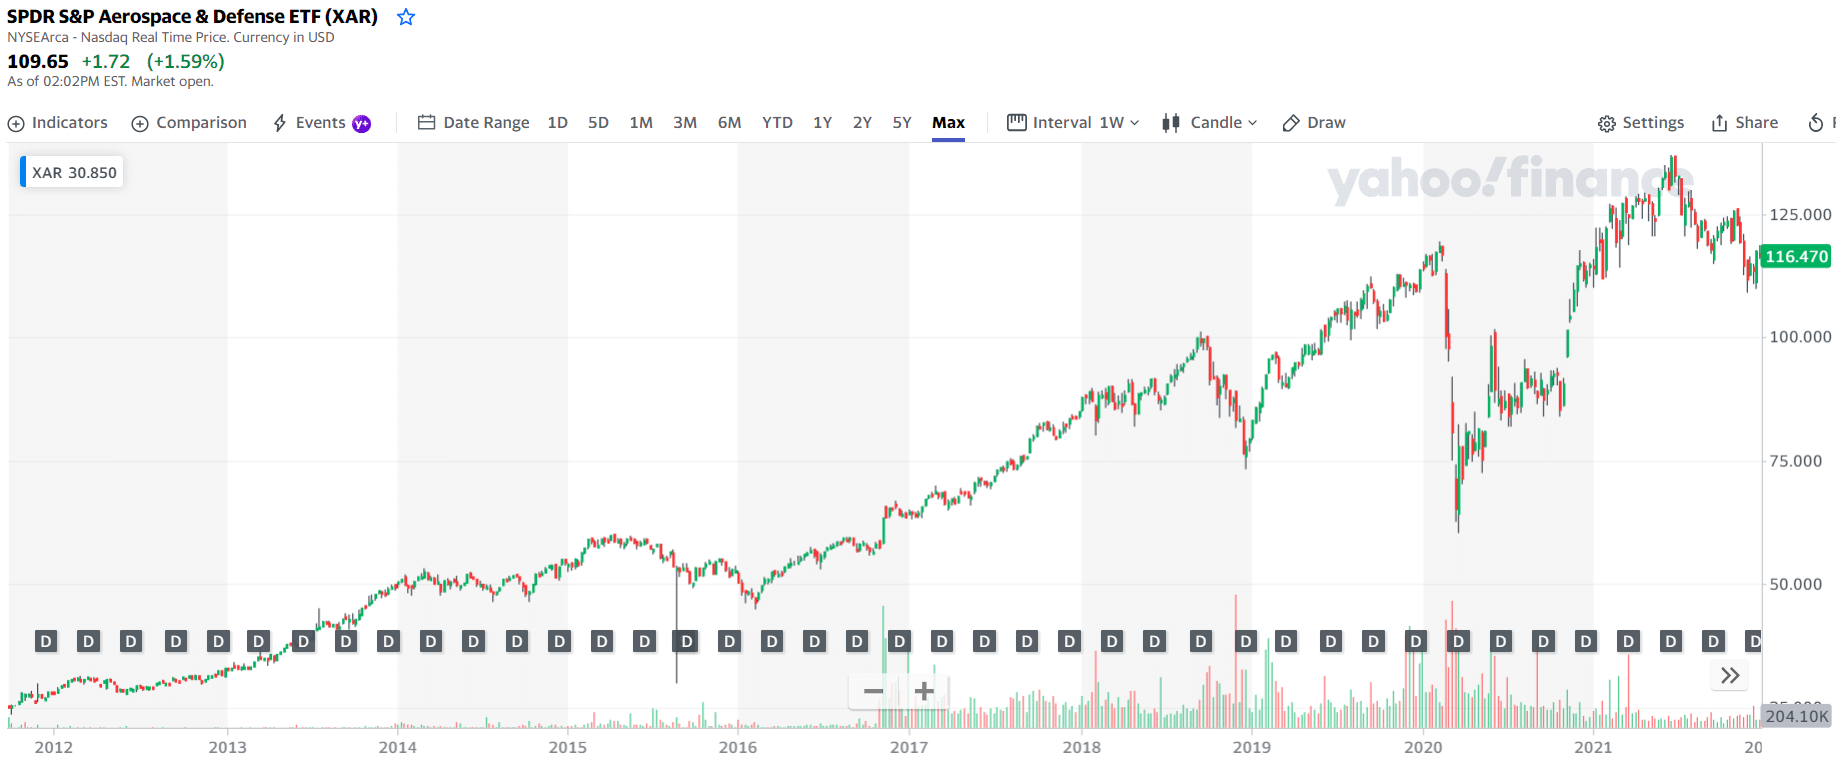
XAR price chart 2012-2022
The first three holdings with their asset percentage are:
- Virgin Galactic Holdings Inc Shs A — 4.49%
- Axon Enterprise Inc. — 4.23%
- Maxar Technologies Inc. — 4.17%
2. SPDR S&P Kensho Future Security ETF (FITE)
Price: $48.15
Market cap: N/A
State Street’s SPDR S&P Kensho Future Security ETF, a variation on the standard military ETF, monitors an index of US firms active in aerospace and defense advancements.
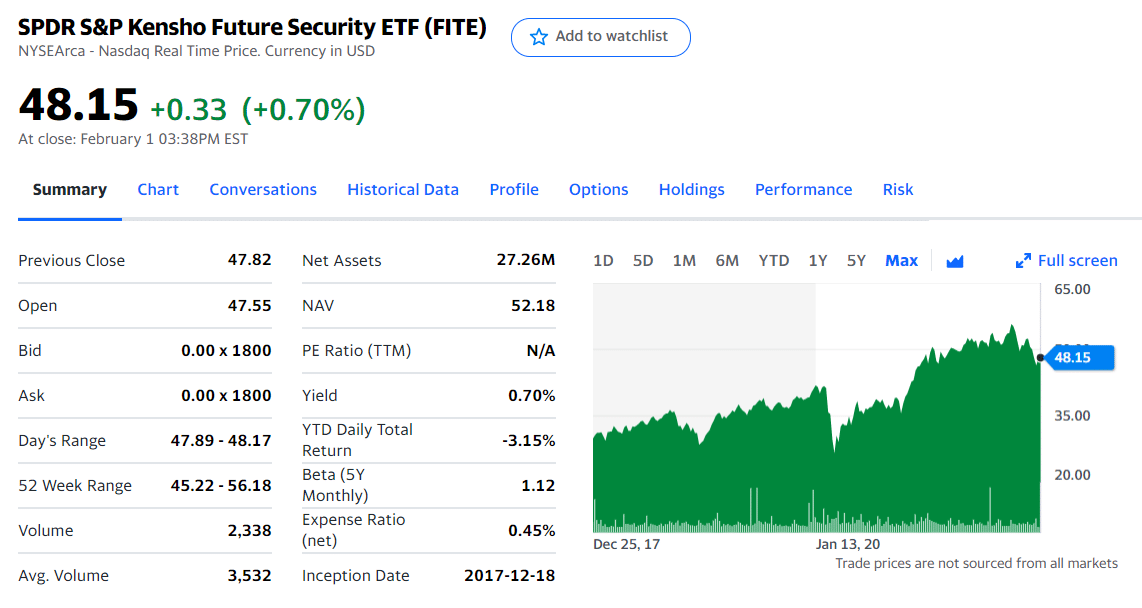
FITE stock summary
As part of its research, FITE looks for companies engaged in different defense-related industries, such as cybersecurity and enhanced border protection, and further breaks down its portfolio into subsectors, including drones, robotics, wearable technology, space tech, and virtual reality.
As a result, while Northrop Grumman, Lockheed Martin, and Raytheon are featured in FITE’s portfolio, they do not dominate it. As a result, FITE has invested heavily in information technology, software, and communications, rather than traditional media.
Since FITE is a defense ETF, it may be the reason why it costs more than the SPDR S&P Aerospace and Defense ETF (XAR) or the iShares US Aerospace and Defense ETF (XAR) (ITA). Instead, investors seeking a more nuanced approach to national defense investing might go to FITE, which isn’t outrageously priced — it’s not even the most expensive military ETF on the market.
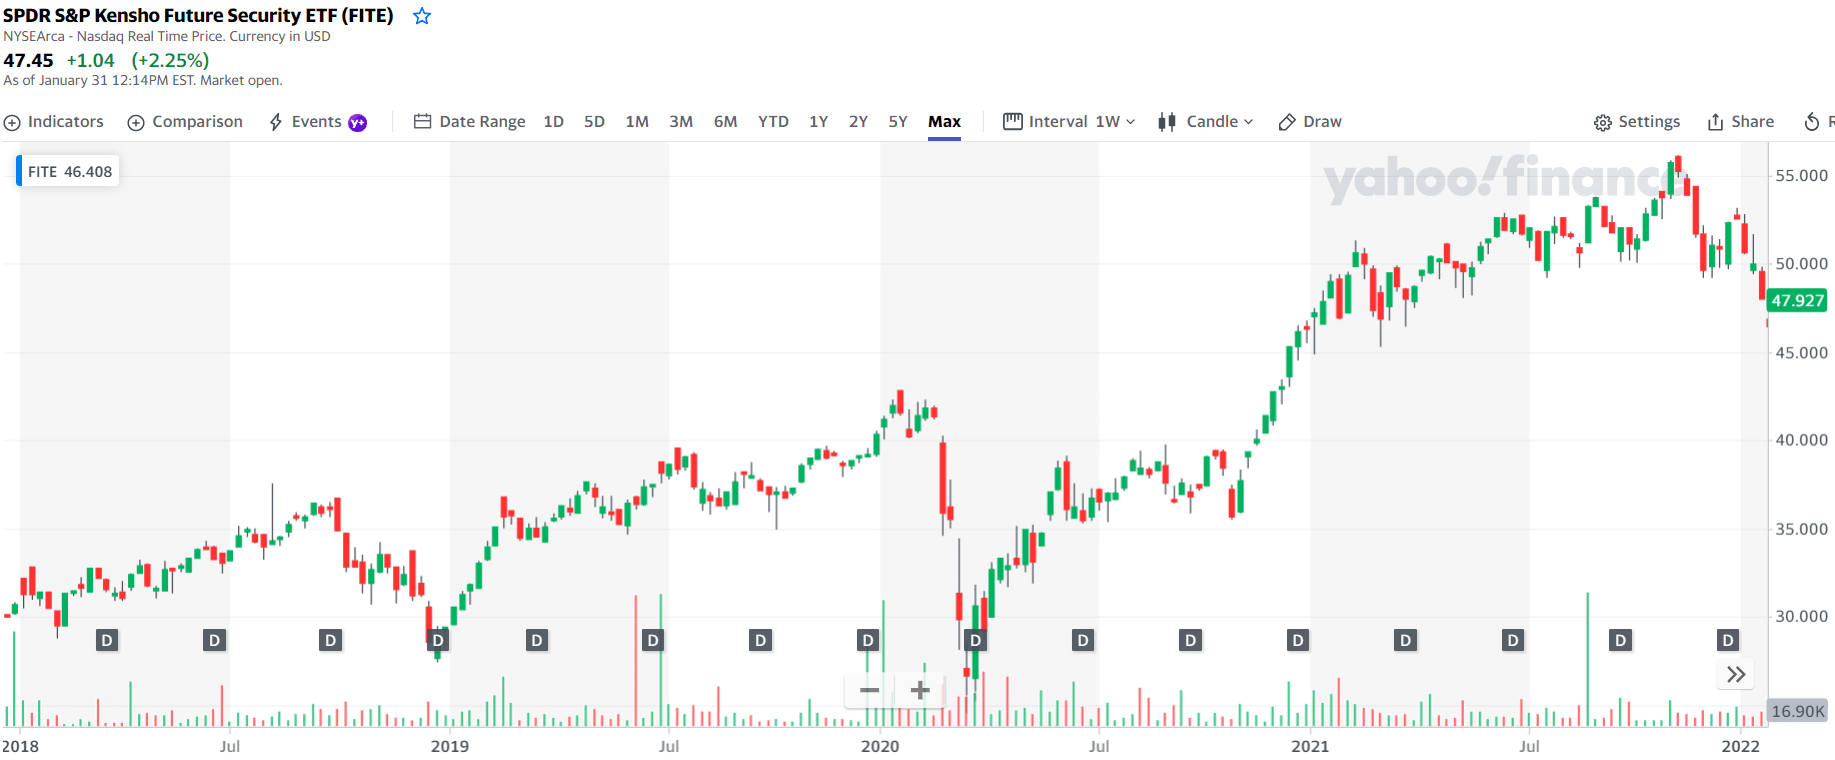
FITE price chart 2018-2022
The first three holdings with their asset percentage are:
- Cloudflare Inc. — 1.75%
- CrowdStrike Holdings Inc Class A — 1.75%
- Varonis Systems Inc. — 1.72%
3. iShares US Aerospace & Defense ETF (ITA)
Price: $102.33
Market cap: $2.68B
This fund invests in the aerospace and military, a fascinating industrial business area. It is uncommon for enterprises in this area to be large and slow-growing but highly stable because of their frequent use of long-term government contracts for most of their services.

ITA stock summary
The government’s role may have a detrimental influence, especially if military financing falls drastically or budget limitations necessitate significant cuts to more ‘discretionary’ defense initiatives. Since PPA is much more expensive, ITA remains a viable alternative for individuals who are willing to accept the hazards of the sector.
PPA may be a better choice for investors looking for a more diverse portfolio due to its higher concentration on top-tier companies and lower liquidity. Contrary to this, despite its relatively undiversified holdings, ITA is an excellent choice for investors seeking exposure to just the industry’s leading brands and those who are most affected by sector trends.
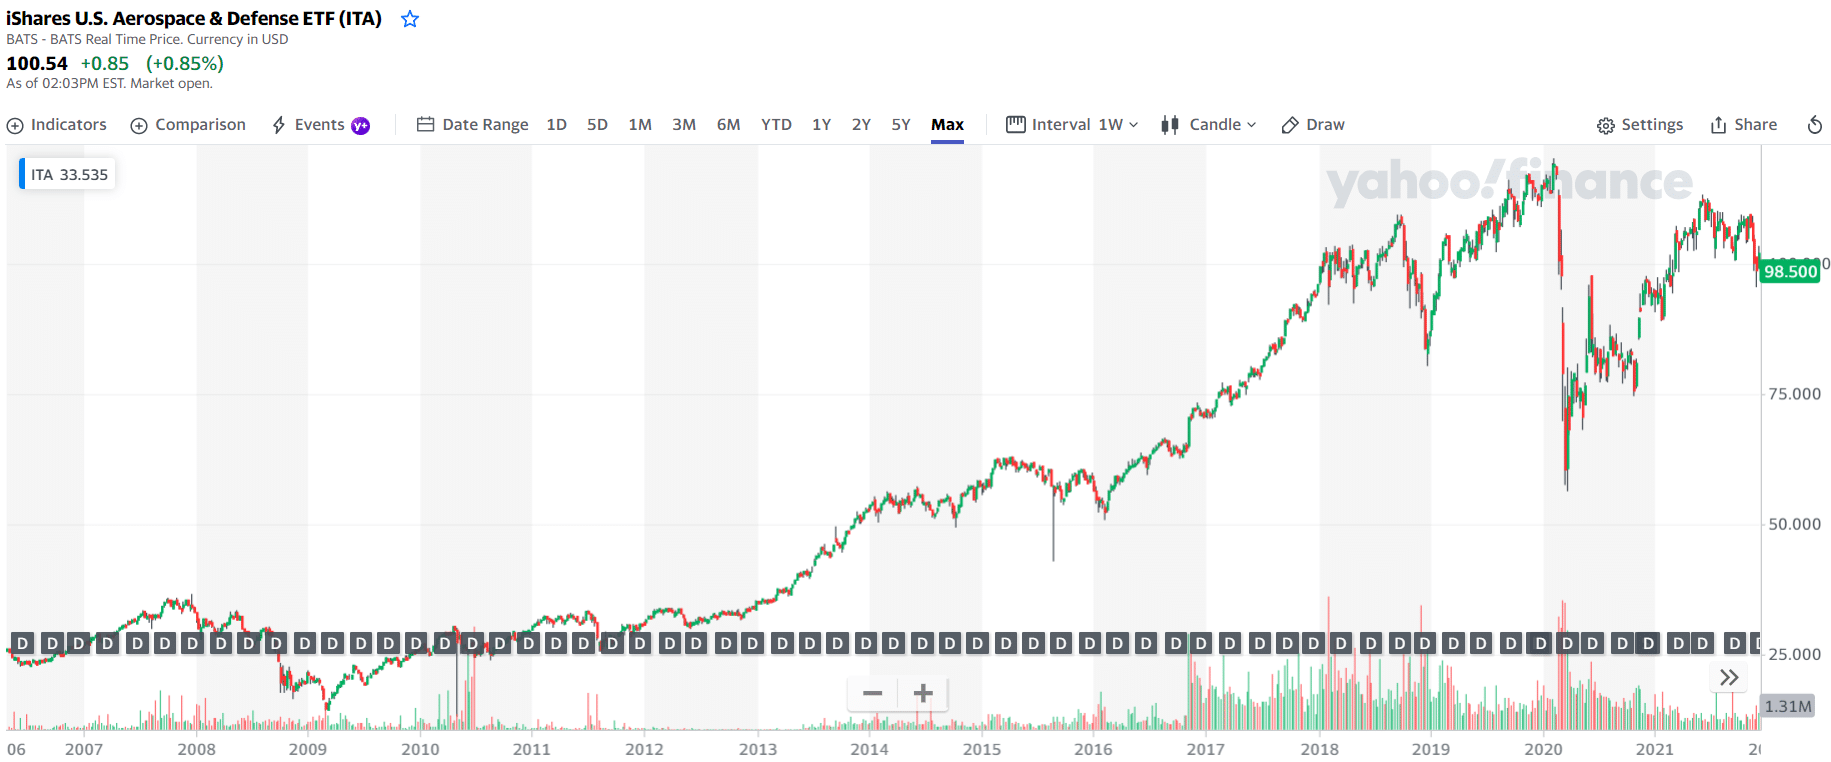
ITA price chart 2006-2022
The first three holdings with their asset percentage are:
- Raytheon Technologies Corp. — 19.71%
- Boeing Co — 18.63%
- Lockheed Martin Corp. — 5.55%
4. Invesco Aerospace & Defense ETF (PPA)
Price: $70.81
Market cap: $626.01M
When constructing the Invesco Aerospace & Defense ETF, the SPADE Defense Index was utilized as a basis (Index).
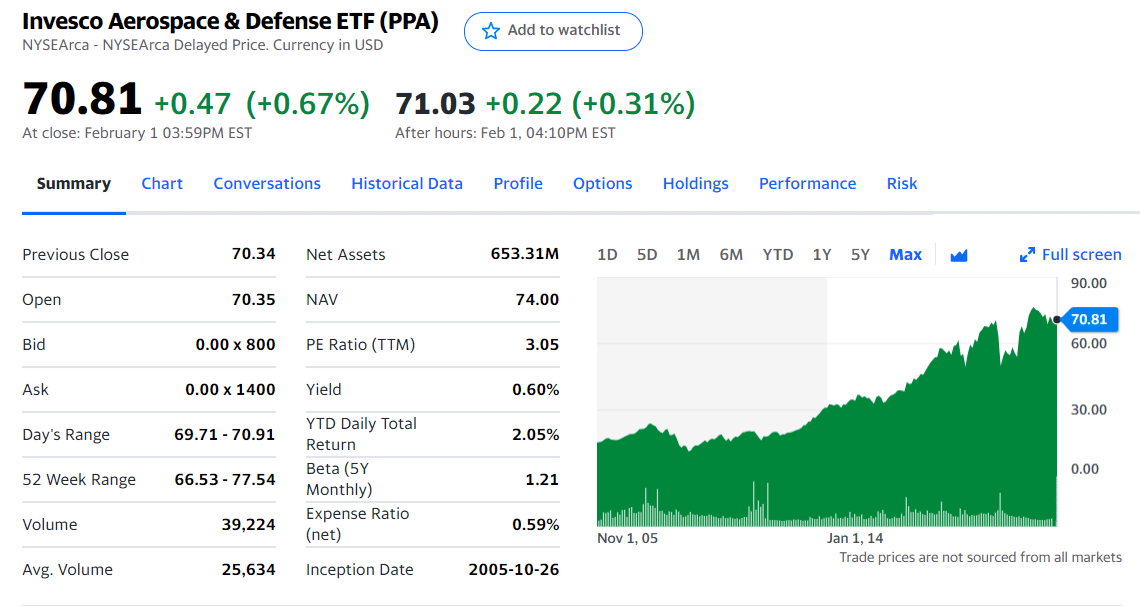
PPA stock summary
The fund typically invests at least 90% of its total assets in the common equities represented by the index. Companies involved in the creation, production, operations, and support of military and homeland security activities have been included in the index. Fund and index rebalance and re-creates itself every quarter.
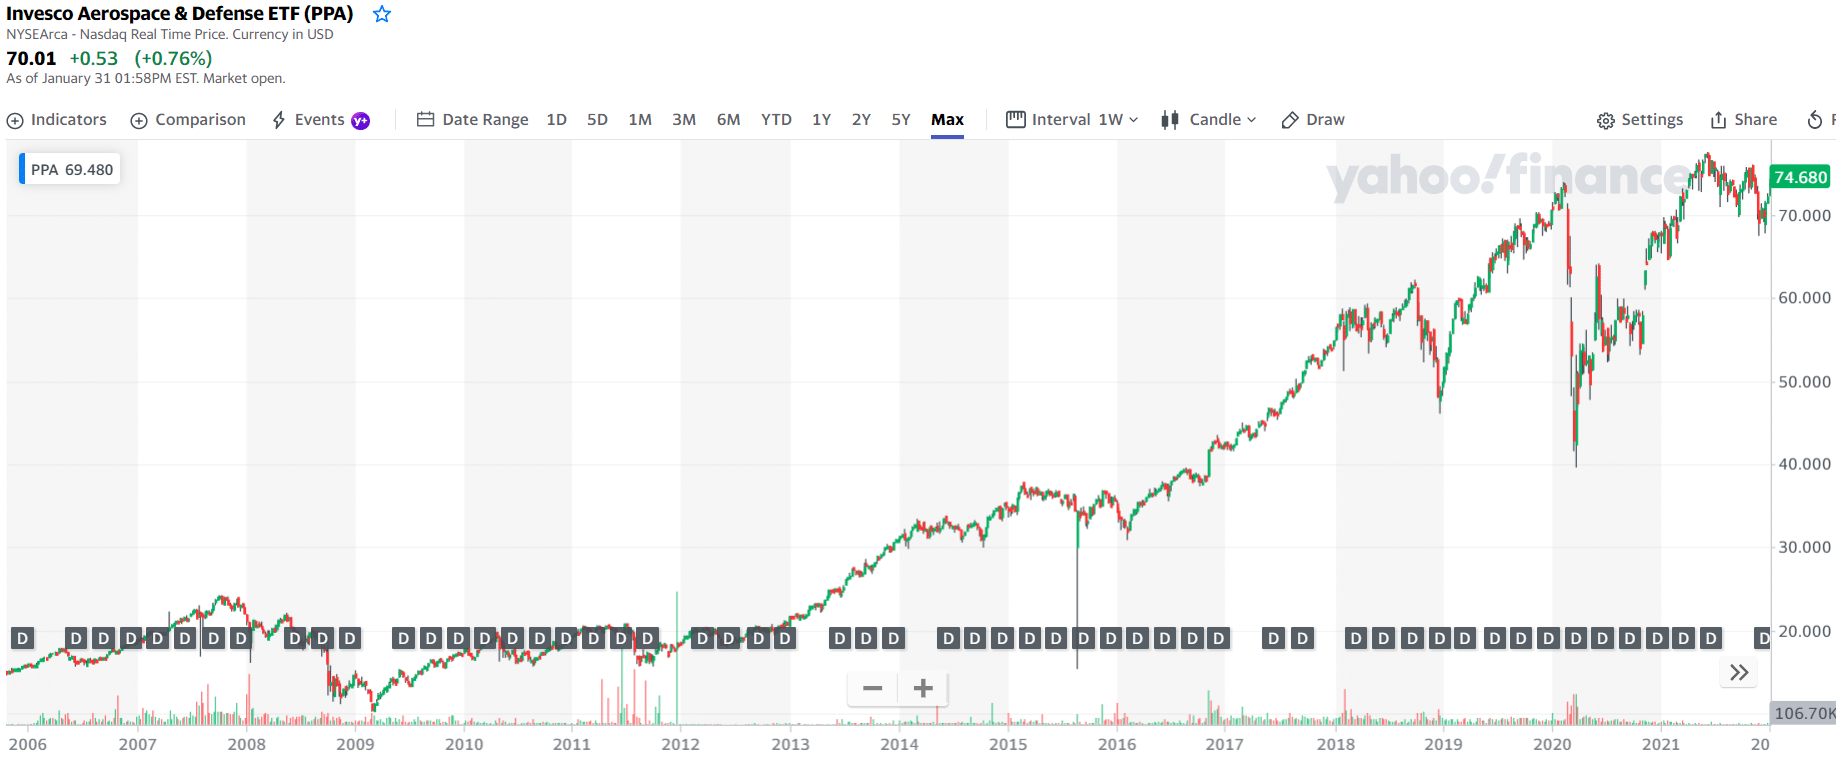
PPA price chart 2006-2022
The first three holdings with their asset percentage are:
- Raytheon Technologies Corp. — 7.13%
- Lockheed Martin Corp. — 6.91%
- Boeing Co — 6.62%
5. SPDR S&P Kensho Final Frontiers ETF (ROKT)
Price: $37.86
Market cap: N/A
USO and the SPDR S&P Kensho Final Frontiers ETF are two more creative names for space ETFs, so give them credit.
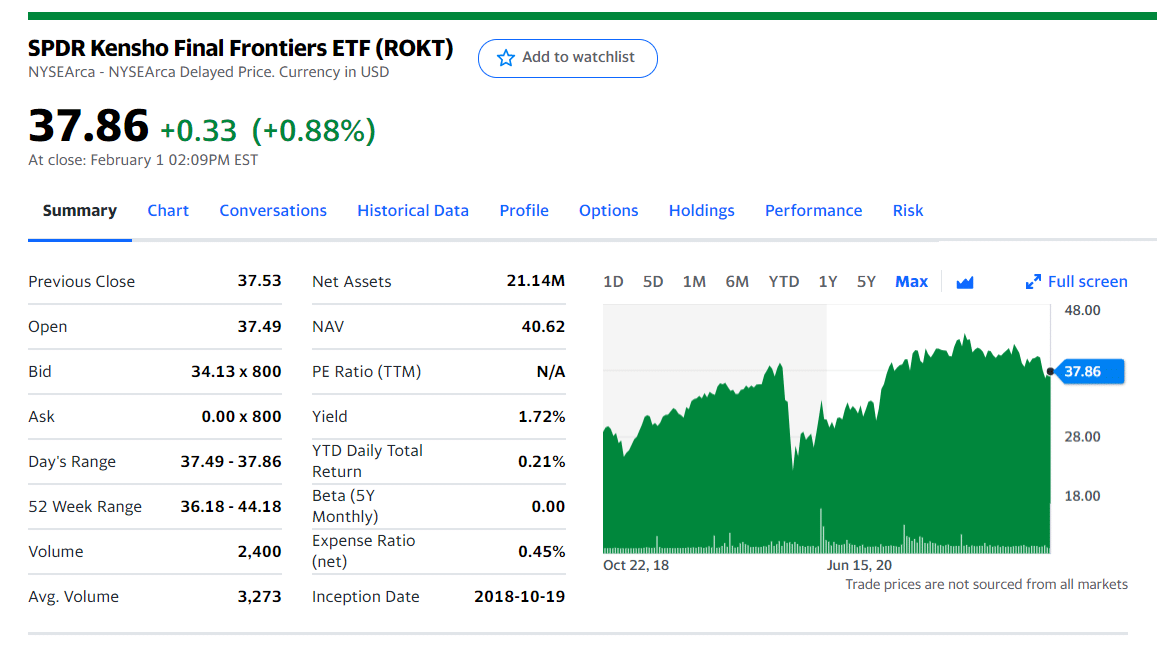
ROKT stock summary
Even though ROKT’s benchmark, the S&P Kensho Final Frontiers Index, contains marine exploration companies. ROKT is a concentrated fund with just 25 holdings due to the ocean/space combination. In addition, it lacks the revenue filters seen in UFO since some of the SPDR fund’s assets are classic, large-cap aerospace and military corporations. However, ROKT is rising, gaining almost 12% in the previous week.
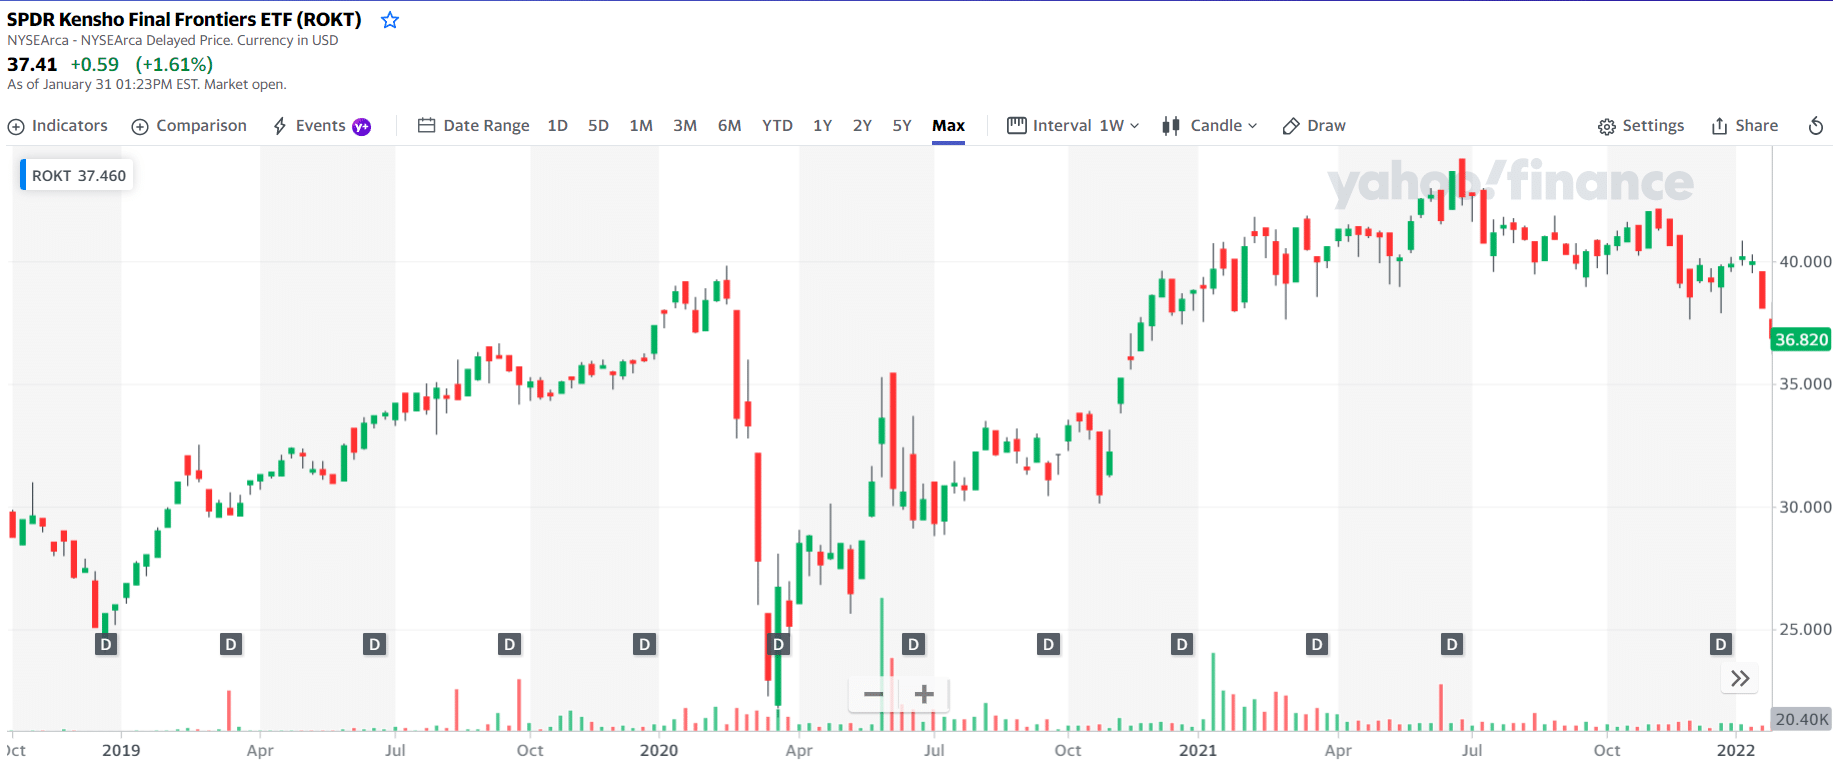
ROKT price chart 2019-2022
The first three holdings with their asset percentage are:
- Virgin Galactic Holdings Inc Shs A — 5.03%
- Maxar Technologies Inc. — 4.32%
- Iridium Communications Inc. — 3.99%
Final thoughts
To observe the stark difference between aerospace and military equities is remarkable. The defense remains a contentious issue because the underlying components are so powerful. Civilians used to benefit from military breakthroughs, but the reverse is also true. Investors may make two investments for the price of one by purchasing stocks in the aerospace and defense sectors.
An increase in the worldwide nature of tourism means that aeronautical components are in high demand during bull markets. It’s essential to keep an eye on this sector. An investor’s best bet may be to take a defensive position during global instability.


Comments