

The stock market is a significant part of the financial industry. It is a market wherein buyers and sellers public listed companies of different countries. As with any other financial market, the stock one helps the participants profit either by trading or investing.
The US stock market alone is currently worth $46,994,123.0 million. The market value is the total market cap of all US-based companies on the public listing in the Nasdaq Stock Market and New York Stock Exchange.
Many people want to get into the stock market field, but as you know, it is scary once you see that significant loss taken by others who do not know how to trade and invest appropriately.
Looking forward, if you are one such spectacular or a trader looking for an excellent strategy to make a profit from the stock market, here is an article for you that will make your predictions more accurate.
What are stocks?
Stocks are the shares of a company that gives you a part of ownership in the firm you are investing in. Here, the owners also get a portion of voting rights on the companies decision-making.
In a more straightforward form, owning a company’s stock indicates that the stockholder retains a part of the organization corresponding to the number of shares held concerning the outstanding shares.
Let’s take, for example, an individual or entity that owns 200,000 shares of a company with one million outstanding shares would have a 20% ownership stake in it.
What is technical analysis and pin bar?
It is a trading method that traders use to examine the price movement on the price chart. In technical analysis, traders use many strategies like the Elliott wave, price action, different indicators, etc., to trade the market.
The strategies and techniques mentioned earlier are good in their way, but the most important one is the candlestick analysis. Candlesticks are the price bar that represents the price movement on the trading chart.
Candle patterns work, and some do not, but the pin bar is one such candlestick that works and gives you an accurate trading setup.
Pin bar has a small body with a long wick showing buyers’ and sellers’ rejection depending on the place and type of the candle. A pin bar is a candle with a long wick at its top if it is bearish, while a long wick at its back is bullish.
How to trade using a pin bar?
The pin bar is a candle you can easily find on your trading chart in a lower time frame, but most of them are just the noise and not the actual candle that would help. So, getting the candle you can use for trading setup will be on a higher time frame, mostly daily or 4hr.
To trade the pin bar, first, you will draw your trendlines — bullish or bearish. It would be best for you if you prefer taking the trades in the trend. Taking the trade in the sideways market is not good, as there is no clear trend, and the price may break out in any direction.
For better understanding, in the below example of Amazon.com, Inc., you can see the bullish trendline; here, the price was moving up. Soon after, the second high price went down to the second higher low and touched the trendline; also, you can see the price forming the pin bar candle.
After the pin bar candle formation at the trendline and new low, it suggests market continuation. This is the setup for you to buy the stock.
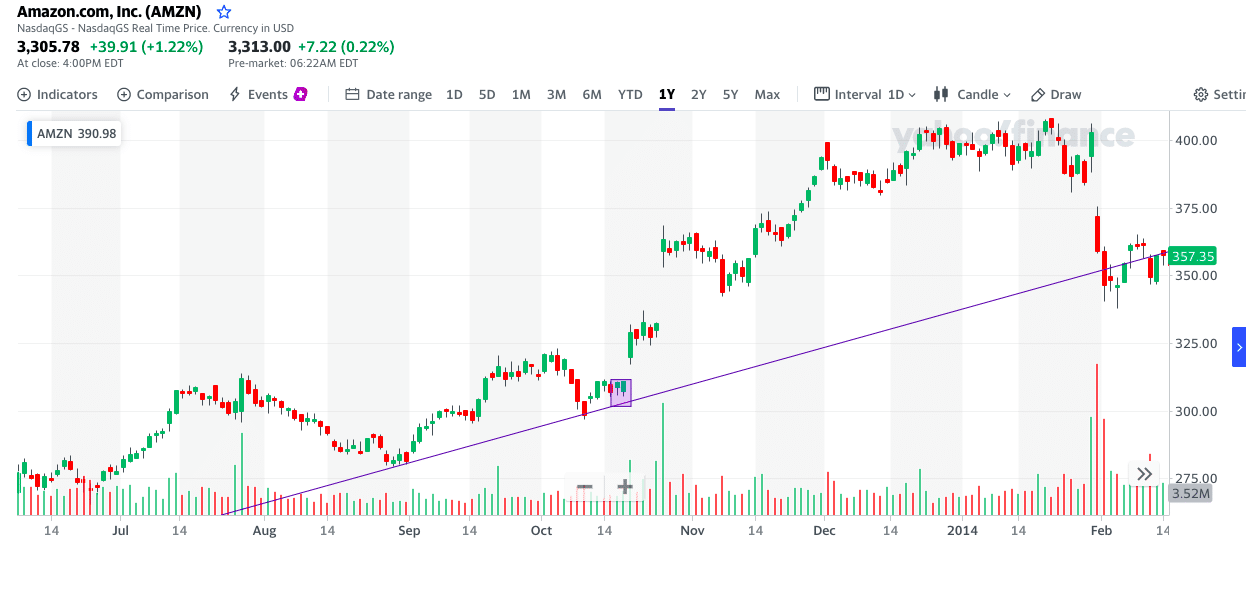
Amazon.com, Inc. chart
In the below example of Amazon.com, Inc., you can see the bearish trendline; the price was moving down here. Soon the price was not able to make a higher high and also broke the previous low. The third high broke the last high, but at the same time, the price formed a pin bar. This pin bar formation was near the bearish trendline, making it a better trade confirmation.
This is the setup for you to sell the stock.
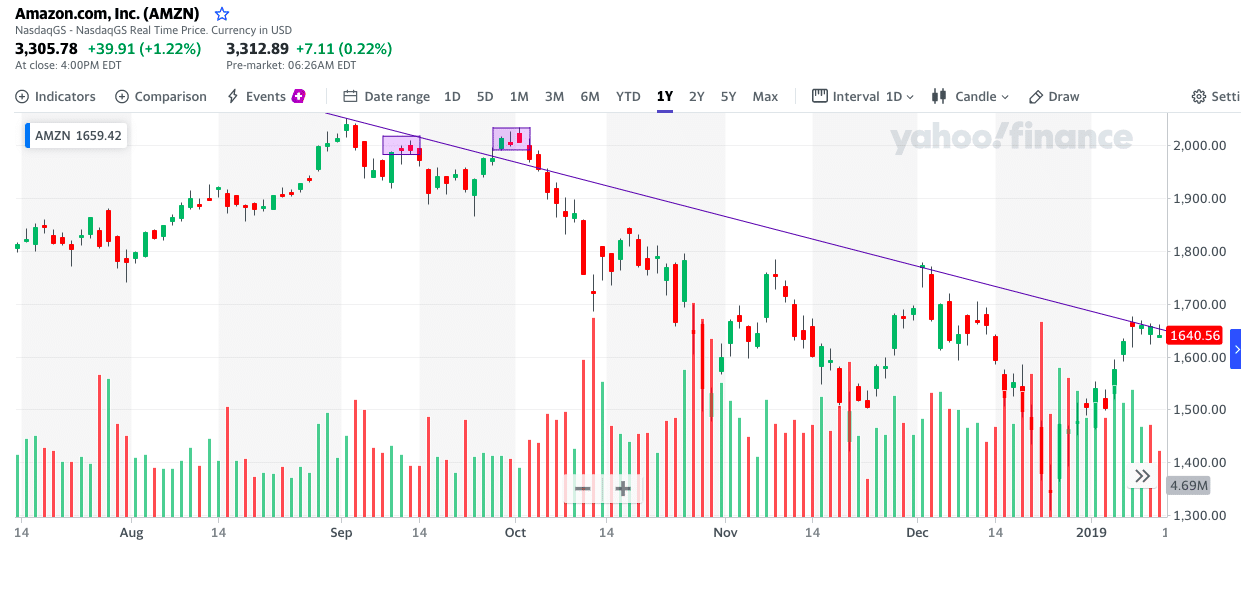
Amazon.com, Inc. chart
Adding indicator
In the above example, you can see just the pin bar used to trade the stock. Now to make the trade more accurate by confluence, we will apply a moving average of 44-period. It is the average of close and open prices of a stock.
- If the price will be above the 44-period moving average, it signals a buy at its swing low or retracement.
- If the price is below the moving average, it signals the sell at the retracement.
But only the price above and below the moving average is not sufficient to take the trade; here, it is always essential to have more information.
In the below example of Amazon.com, Inc., the price respected the 44-period moving average and the trendline going up. The pin bar formation in this place is an extra confirmation for a buy setup.
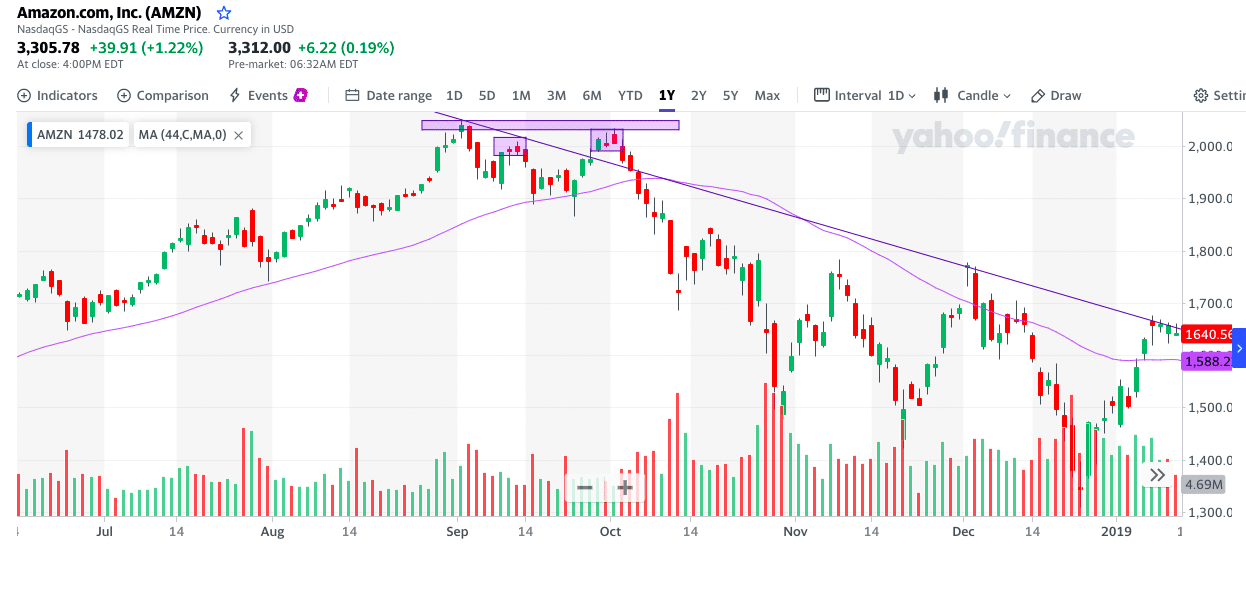
Amazon.com, Inc. chart
In the below example of Amazon.com, Inc., the price respected the 44-period moving average and the trendline going up. The pin bar formation in this place is an extra confirmation for a buy setup.
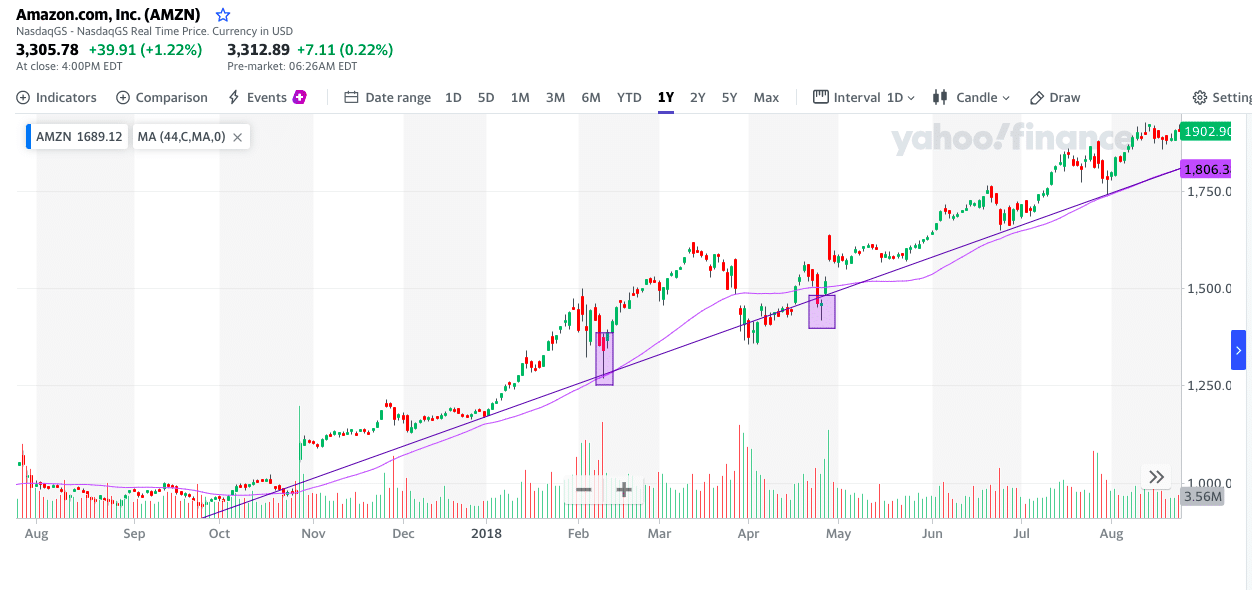
Amazon.com, Inc. chart
Note: In the above example, you will see there are three confirmations from different ways.
- First, is the price already moving upward; this signifies you will go with the trend, taking only buy calls.
- Second, there is a pin bar candle formation.
- The third is the moving average supporting the signal, giving extra confirmation.
Final thoughts
Trading this strategy is easy, but at the same time, nothing is full proof in trading and investing. For much better results, you must learn candlestick analysis and price action.
Indicators work fine, but in some situations and not always, most of them are lagging and give late entry and exit signals. Trade confirmations always go into the lower time frame to look for the actual happenings and rejections from a particular zone.
A pin bar is an excellent candle to trade, but most traders misuse it. You must never expect the market to reverse by just seeing a pin bar candle, as any single candle does not decide the market direction and movement.
Always look into the overall fundamentals first and then analyze the market.


Comments