

Investor relations guide refers to the framework that informs how a company interacts with its shareholders; finance, communication, and marketing.
The most important of all these variables to an investor is financial information. The only reason why people get into investment is to grow their wealth and have regular passive income. Therefore, as an investor, the critical information that guides investment decisions is essentially the financial health of an organization.
As such, organizations that have world-class investor-relations provide the following reports in a timely and transparent manner:
- Income statements
- Cash flow statements
- Balance sheet statement
The analysis of these reports forms an investment basis for new investors and a foundation for reinvestment.
Here, we look at these reports through the eyes of an investor for stock picking purposes. However, first, we choose three companies operating in different economic sectors for comparison.
-
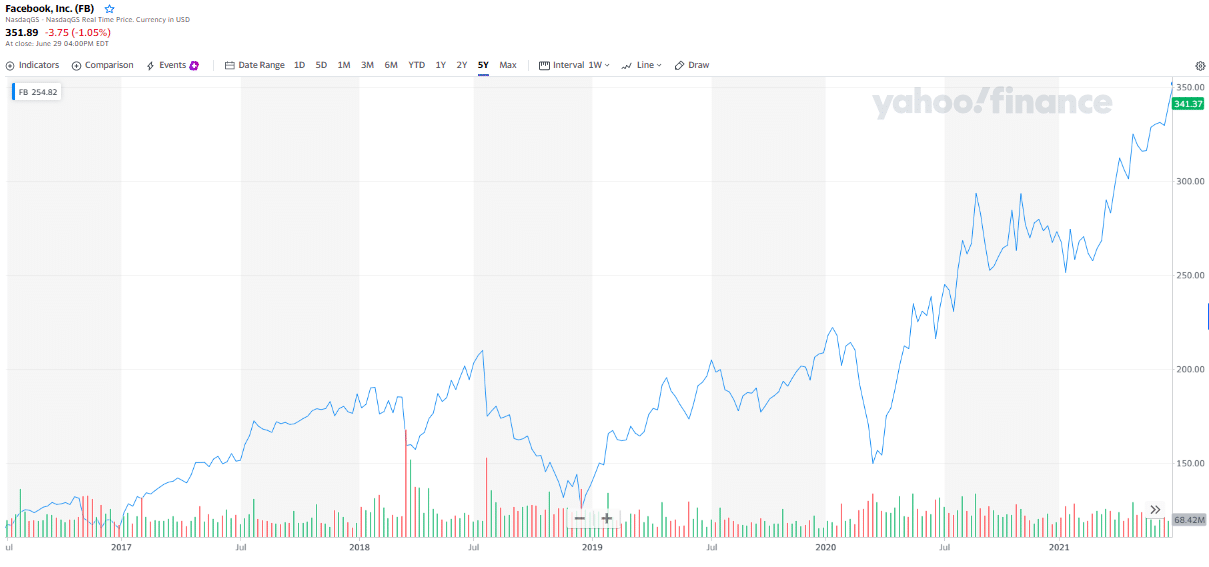
Facebook, Inc. (FB)
A company in the communication services sector.
-
Johnson & Johnson (JNJ)
A company in the healthcare sector.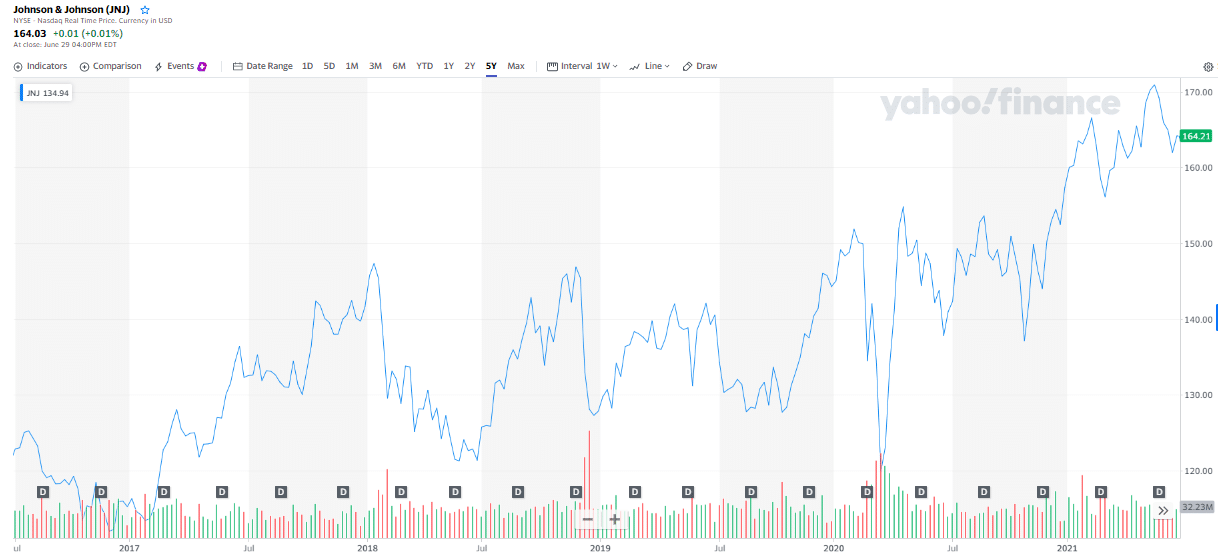
-
Qualcomm Incorporated (QCOM)
A company in the technology sector.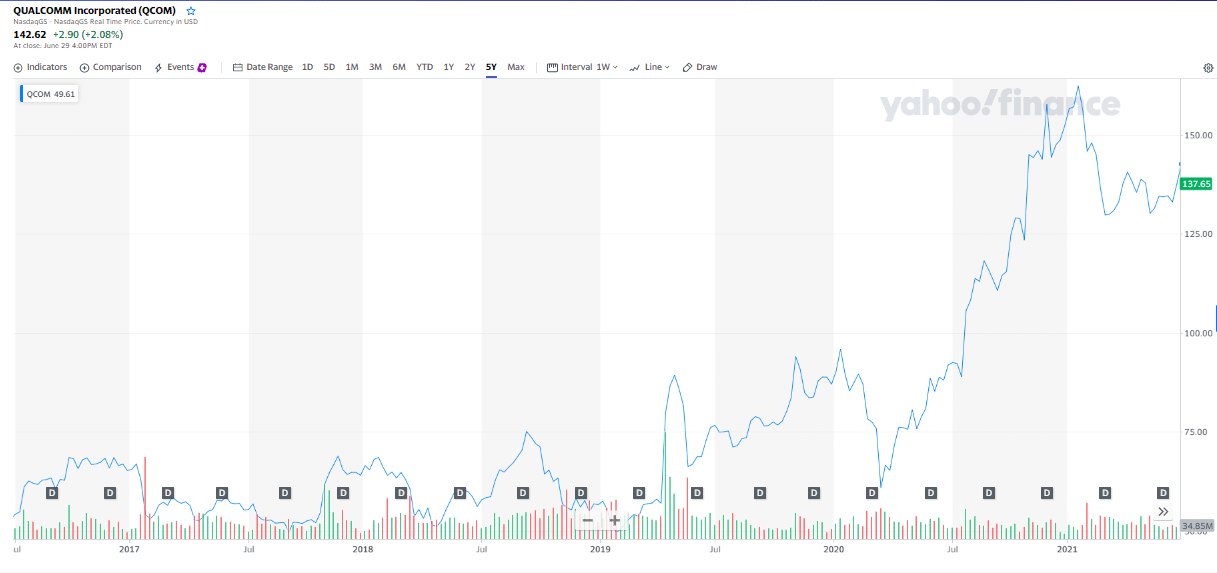
№ 1. Income statement
| Metrics | Johnson & Johnson | Qualcomm Incorporated | |
| Total revenue | 85,965,000 | 82,584,000 | 23,531,000 |
| Tax | 4,034,000 | 1,783,00 | 521,000 |
| Shares outstanding | 2,921,000 | 2,632,512 | 1,130,000 |
| Cost of revenue | 16,692,000 | 28,427,000 | 9,255,000 |
| Normalized EBITDA | 39,662,000 | 24,357,000 | 7,783,000 |
| Diluted EPS | 10.09 | 5.51 | 4.52 |
| Margin (before interest, tax, and dividends) | 46% | 29% | 33% |
| Unusual expenses | -129,000 | -428,000 | -69,000 |
All data in the table is in thousands and as of the end of the 2020 financial year.
An analysis of the income statement of an organization informs investors on:
-
Revenue
Growing revenues, year on year, are a testament to the innovative nature of an organization and an increase in the adoption of its products by its target market. On the other hand, declining sales point to a struggling organization in product innovation or management. Of the three companies, Facebook has the most revenues hence the stock to invest in, based purely on revenues.
-
Margins
This is a measure of how profitable a company is given its total revenues. Always compare the margins for organizations in the same industry and find the median margin. Go for stocks that display higher margins than the industry average since they represent an ability for the company to meet increasing expenses. Once again, Facebook carries the day while using this particular metric.
-
Earnings Per Share
EPS pits the outstanding organizational shares against the net income. Thus, it measures how much is invested in a share payback given the profits of the organization. Facebook once again proves too valuable not to invest in when EPS is under consideration.
Therefore, for the three companies, income statement analysis points to Facebook equity being the better investment option.
№ 2. Cash flow statement
| Metrics | Johnson & Johnson | Qualcomm Incorporated | |
| Beginning cash | 38,747,000 | 23,526,000 | 5,814,000 |
| Operations CF | 38,747,000 | 23,526,000 | 5,814,000 |
| Financing CF | -10,292,000 | 6,120,000 | -5,707,000 |
| Investing CF | -30,059,000 | -20,825,000 | -5,623,000 |
| End cash position | 17,954,000 | 13,985,000 | 6,707,000 |
| Free cash flow | 23,632,000 | 20,189,000 | 4,407,000 |
All data in the table is in thousands and as of the end of the 2020 financial year.
An analysis of the cash flow statement reveals whether historical cash sources and expenditures will recur shortly. As an investor, the organization of interest should generate sufficient positive cash flows, which are a measure of:
-
Operating cash flows
Measures how well a company can generate revenues from its primary activities. It should show a consistent positive cash flow.
-
Investing cash flows
The measure of a company’s returns for other investments. They should be positive so as not to eat on operating cash flows.
-
Financing cash flows
The measure of a company’s ability to pay its short-term and long-term debts. A negative figure shows a company in the process of debt payment, either to creditors or issuing dividends, or both.
Analysis of cash flow statements for the three companies shows that Johnson and Johnson has a positive net cash flow, considering only the three indicators, hence the best stock based on these metrics.
№ 3. Balance sheet statement
| Metrics | Johnson & Johnson | Qualcomm Incorporated | |
| Cash/cash equities | 54,855,000 | 19,287,000 | 12,260,000 |
| Total accounts receivables | 9,518,000 | 14,481,000 | 2,471,000 |
| Inventories | N/A | 9,020,000 | 1,400,000 |
| Total assets | 133,376,000 | 157,728,000 | 32,957,000 |
| Total capitalization | 101,054,000 | 85,965,000 | 18,346,000 |
| Issued shares | 2,852,000 | 3,119,843 | 1,145,000 |
All data in the table is in thousands and as of the end of the 2020 financial year.
A balance sheet statement reveals an organization’s liabilities, assets, and net equity. Through it, investors can tell if an organization paid or increased its debt, the value of assets held increased or decreased, and the organization’s liquidity.
The critical analysis should include:
-
Company assets
Here you look at inventory, cash and cash equivalents, and accounts receivables. They help identify both fixed and current assets held by an organization. When it is positive and has large volumes, it points to an organization that can meet its obligations; always compare it to the total liabilities.
-
Total liabilities
These are the obligations of the organizations. Look at both the short-term and long-term debts. Through the short-term obligation analysis, investors understand the liquidity position, while long-term debt analysis reveals the leverage position of an organization, capital structure, and long-term financial commitments.
-
Share structure and balances
An analysis of the share structure and balances helps investors gauge the market liquidity of equities, investor confidence in these stocks, and their intrinsic value.
A balance sheet analysis shows that of the three companies above, all have strong balance sheets. However, among the three, Facebook is better placed than the rest.
Final thoughts
A healthy financial position is vital for not only investors but the companies under consideration for investment. Therefore, fundamental analysis based on the financial statements in the investor relations guide is not an option when choosing stocks but the bread and butter of successful investors.
Pro tip: assign different weights to the various financial statements depending on individual companies and specific industry standards.
In our case, Facebook carries the day as the stock to invest in for both wealth growth and income generation.


Comments