
Everyone is looking for the holy grail in currency trading. That is why a staggering number of trading strategies are already in existence, both free and paid. However, success in currency trading ultimately depends on the user of a trading strategy, not on the strategy per se.
Whether you use a simple or sophisticated trading method, that will not define a successful trader. It is how you follow the trading rules, make adjustments as you see fit, and align the strategy with your style that will determine your success.
In this article, we will present to you a straightforward strategy. The name of the strategy is daily SRB. The term SRB stands for “support/resistance break.” Take a look at this strategy. You might find something that you can add to your trading arsenal.
Understanding candlesticks
Before we get to the entry rules, we have to review candlesticks first. Here we have selected one bullish candle and one bearish candle and marked the corresponding prices. Since you will use a candlestick chart with this strategy, you must know the makeup of a candle. Refer to the EUR/AUD daily chart below.
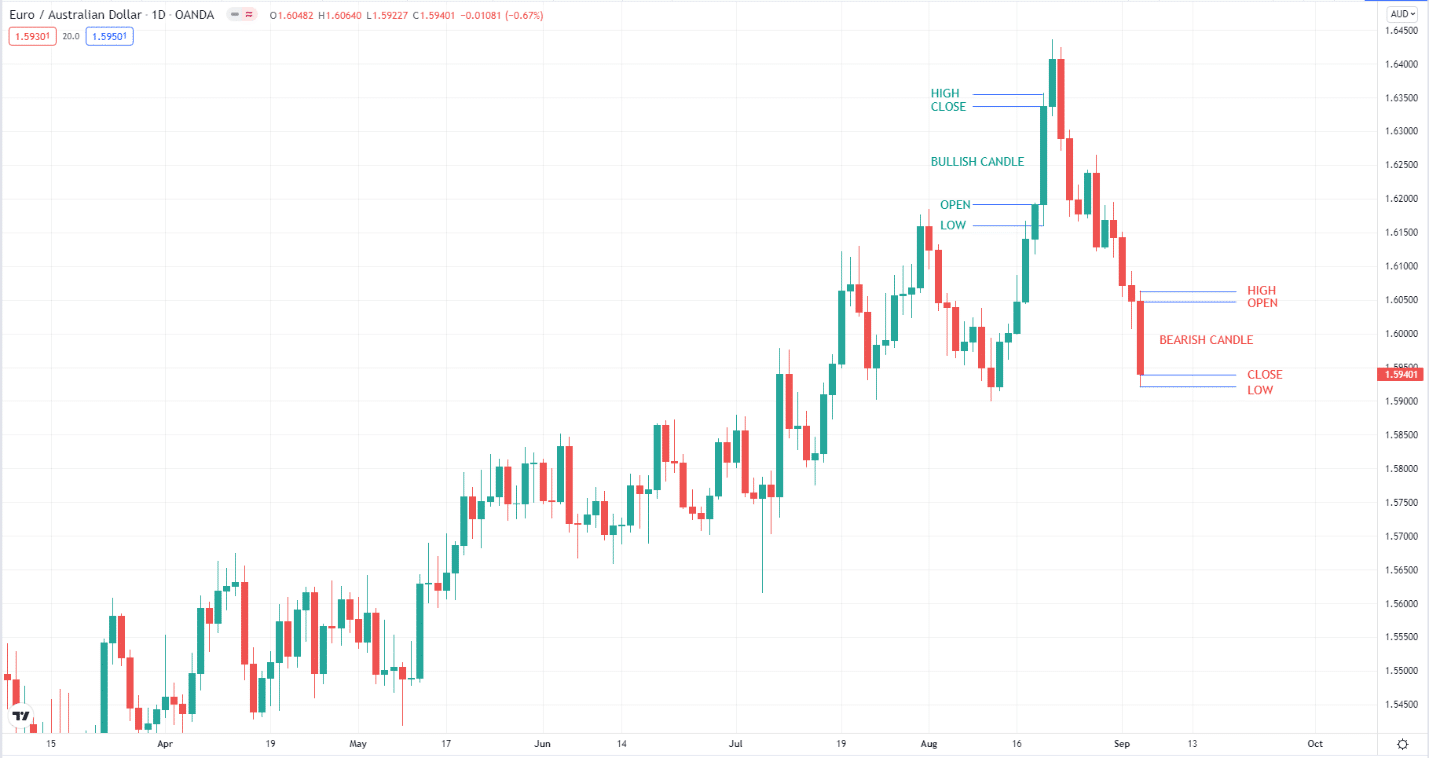
Euro/Australian dollar
Drawing breakout lines
After learning about the components of a candlestick, you are now ready to draw the support and resistance lines. As the name of the strategy suggests, you will be trading a breakout of support or resistance on the daily chart. However, the concept of support and resistance (S&R) used in this strategy differs from what we normally know as support or resistance.
When looking for a trade opportunity, you will refer to the previous day’s candle, mark S&R levels, and trade the breakout of these levels. The chart below shows how you can identify the daily S&R.
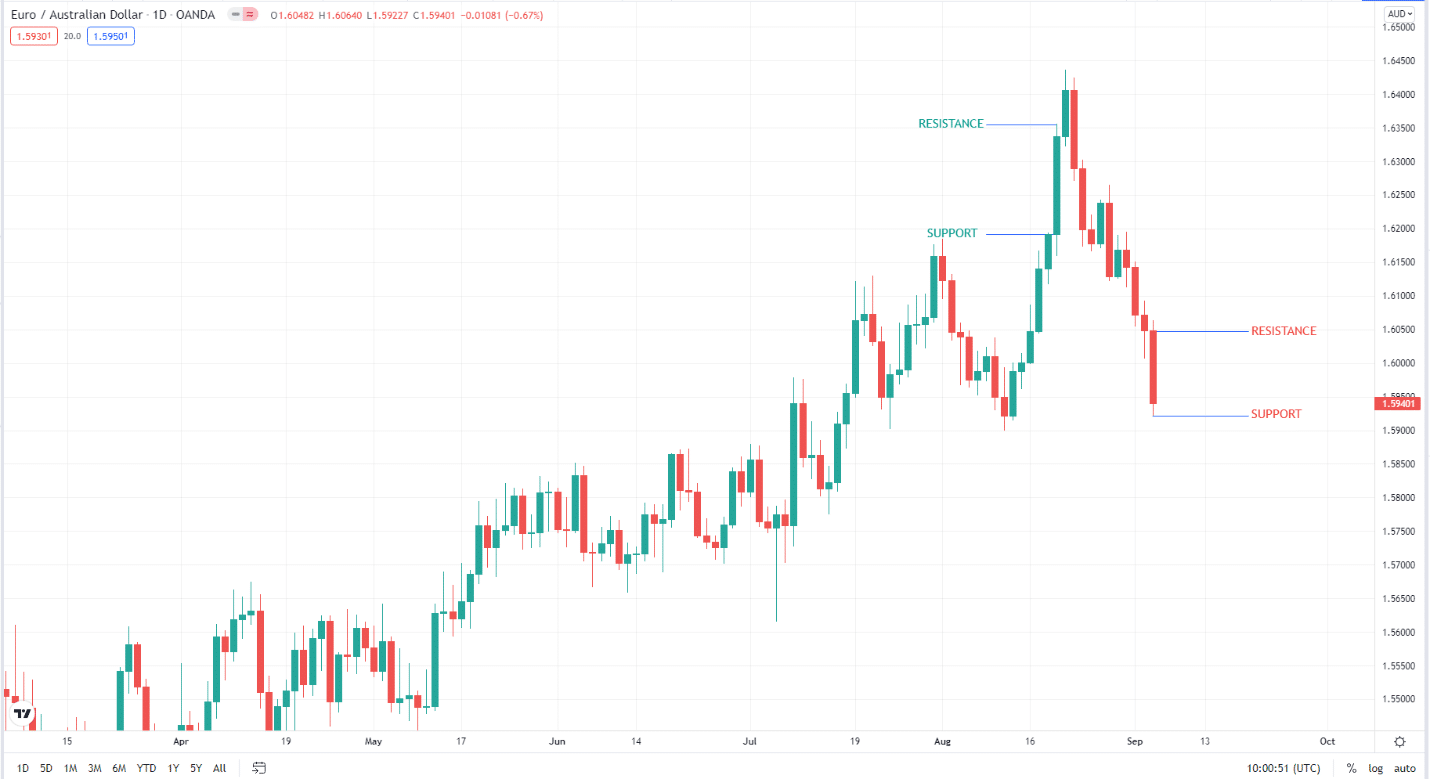
Euro/Australian dollar
For a bullish candle (green), use the high price as resistance and the open price as support. We are not interested in the close and low prices here. For a bearish candle (red), use the low price as support and the open price as resistance. We are not interested in the high and close prices here.
Judging from the chart above, you must have figured out that regardless of the sentiment of the previous candle, that is, bullish or bearish, you can still take a buy trade or a sell trade depending on the price action of the current day. If price breaks support, you will open a sell trade, and if price breaks resistance, you will take a buy trade.
Entry rules
To find a trade entry, do the following steps:
- Mark the resistance and support lines of the previous day with horizontal lines.
- Go down to the five-minute chart to find an entry.
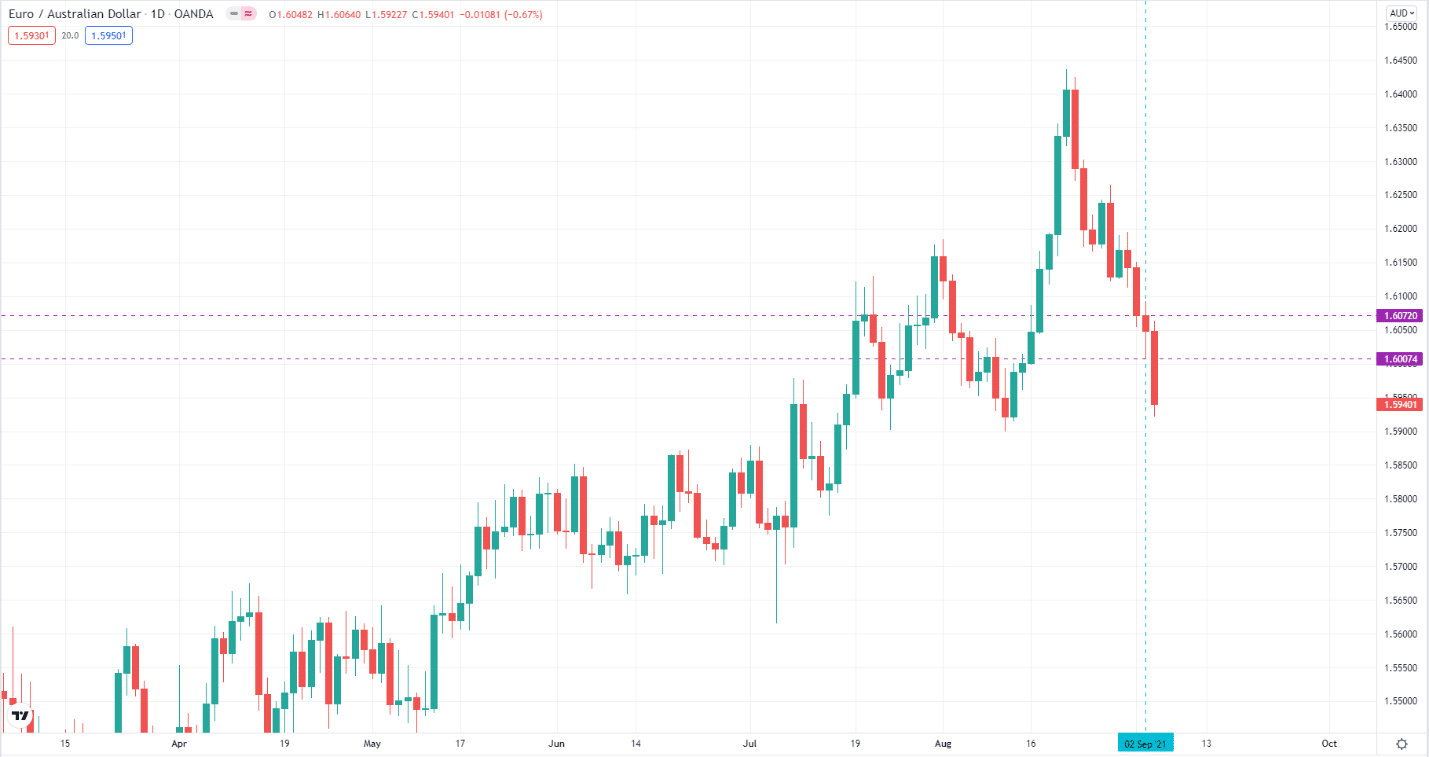
Euro/Australian dollar
Let us continue with the same EUR/AUD daily chart. Let’s consider the daily candle on 2 September 2021. We have marked the support and resistance lines with horizontal lines.
- Support is at 1.60074.
- Resistance is at 1.60720.

Euro/Australian dollar
Next, we go down to the five-minute chart to find an entry. First, we marked the first and last candles of the daily candle being considered with vertical lines. After the previous candle closed, the price approached but did not touch the resistance line and eventually broke the support line and closed beyond it. This break-and-close scenario is our trigger for a short entry.
Exit rules
There are two exit rules you can use for this strategy. The first exit rule is explained below:
- Use a fixed number of pips as the stop loss. This number depends on the pair being traded. For example, you can use 20 pips for EUR/USD and 30 pips for GBP/USD. For other pairs, you need to do manual testing to determine this number.
- Use a take profit target that is a multiple of the stop loss distance. You can use a 1:1 stop loss – take profit ratio or higher as you see fit.
If you do not want backtesting to determine the stop loss figure for each pair you like to trade, you can use the second exit rule. While the first stop loss is static, the second stop loss is dynamic. The second exit rule is discussed below:
- Use the 20 EMA as the stop loss. The stop-loss price is the value of 20 EMA corresponding to the breakout candle.
- After the breakout candle closes, measure the distance from the close price of the breakout candle to the 20 EMA. If you want to use a 1:1 risk-reward ratio, then this number of pips is your take profit target. If you’re going to use a 1:2 risk-reward ratio, multiply this number by two.
The second exit rule is shown in the chart below.
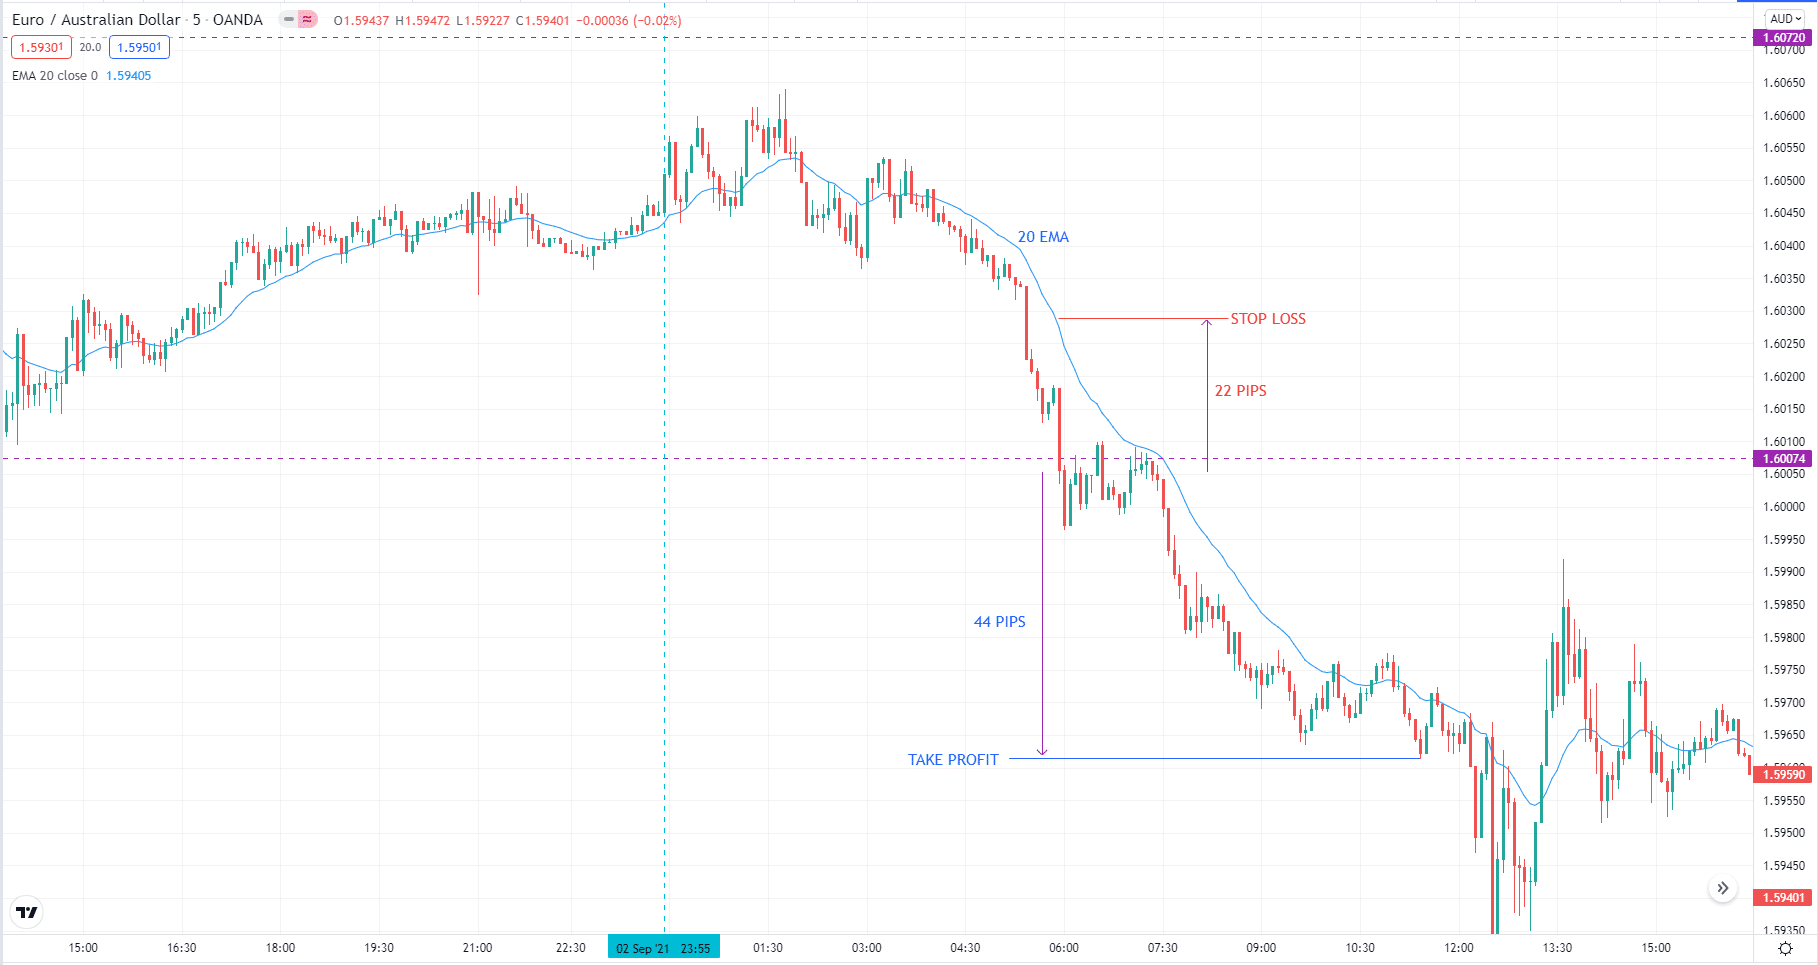
Euro/Australian dollar
Why not use the high and low?
Perhaps you are familiar with a similar breakout strategy that utilizes the high and low of the previous day as a trigger for entry. Most online resources provide such a strategy. The beauty of the method presented in this post is that it allows you to get more pips as the trade triggers early.
The downside is that it is riskier than the traditional high-low counterpart because you might take trades prematurely. The problem with using high and low prices as triggers for entry is that there are occasions when the previous candle has a wide range from high to low. You could miss a trade opportunity or some pips if you wait for the high or low to be taken out.
Trading tips
This strategy is powerful when the pair being traded is trending. Open some daily charts, and you will see. The enemy of this strategy is a ranging market. In principle, the odds for success are against you as a user of this method.
This is because markets tend to range more than trend most of the time. To compensate for this disadvantage, you should use an excellent risk-reward ratio, which should be 1:2 or higher. Determine what balance works best in which currency pairs through demo trading.
Final thoughts
You have learned here a simple method to trade the current market. This is not the holy grail, but you can do something to make it work for you. Combined with other tools in your repertoire, you might find a good setup that will give you an edge in the FX.
To see if this strategy makes sense, you can do hand testing. Open some charts and see how this strategy could have played out in the past using historical data. Make some adjustments to the trading rules. Then see if the method performs well in demo trading.


Comments