Trend trading is a simple, easy-to-follow trading strategy. However, traders fail at it time and again and conclude that it does not work. This may be true to some extent, but not always. Some traders believe that trend trading worked in the past, works today, and will work even in the future. One such trader is the great Ed Seykota, one of the most renowned trend traders. However, he attributed his success not to the trading style itself but in the trader’s psychology.
Trend trading is based on sound market principles. Even if a market moves into a range for a while, it will always break into trends after some time. The main challenge for traders is the transition from one market condition to another, ranging from trending to reversing and vice versa. These things seem to come without warning, where the problem lies.
In this article, let us take a deep dive into trend trading, reviewing its main tenets, understanding the pros and cons, and learning a simple but effective strategy.
What is crypto trend trading?
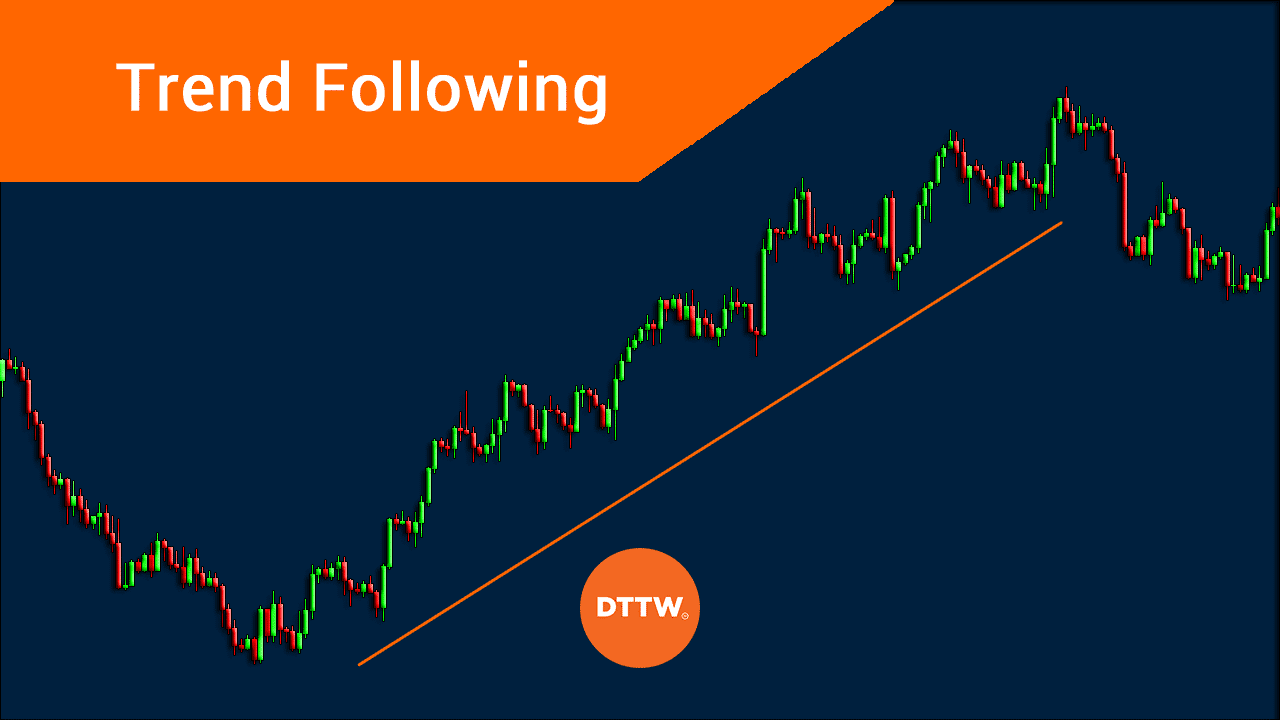
Crypto trend trading is a trading approach that seeks to generate profits by identifying the direction of the trend and trading in this direction. When a crypto asset moves in a specific direction, either upward or downward, that market is in a trend despite the oscillations. While there are several tools you can use to determine the trend, the same can be achieved using your eyes. See the image below.
Once you identify that the trend is bullish, you will take only long trades. A crypto market moving in an uptrend often makes a step-up ladder formation. Meanwhile, once you determine that the trend is bearish, you should only take short trades.

What is a trend?
How to test a crypto trend trading strategy?
There are three main ways to test your trend trading strategy in the crypto market. These are explained in some detail below:
- Manual test
After you have figured out a trend trading strategy or find it somewhere, you can do a cursory back test to see if it has merits. To do this, you need to open one or two crypto charts and then find situations in the past where the scenario exists. By counting the number of times the setup works over the total number of setups, you can tell if the strategy is profitable or not.
- Algorithmic test
To thoroughly test your newfound strategy, you can use a robot to run the system in different symbols, time frames, and even platforms. With this type of testing, you can generate statistics such as profit factor, payoff, max drawdown, win rate, and others to decide whether the program does work statistically.
- Demo test
While manual and algorithmic tests can give you a hint that the strategy works, nothing could replace the value of running the program in live market conditions. Because you subject the system to a real-time market environment, all factors in every trade include spread, volatility, news events, and others.
Bullish trading strategy

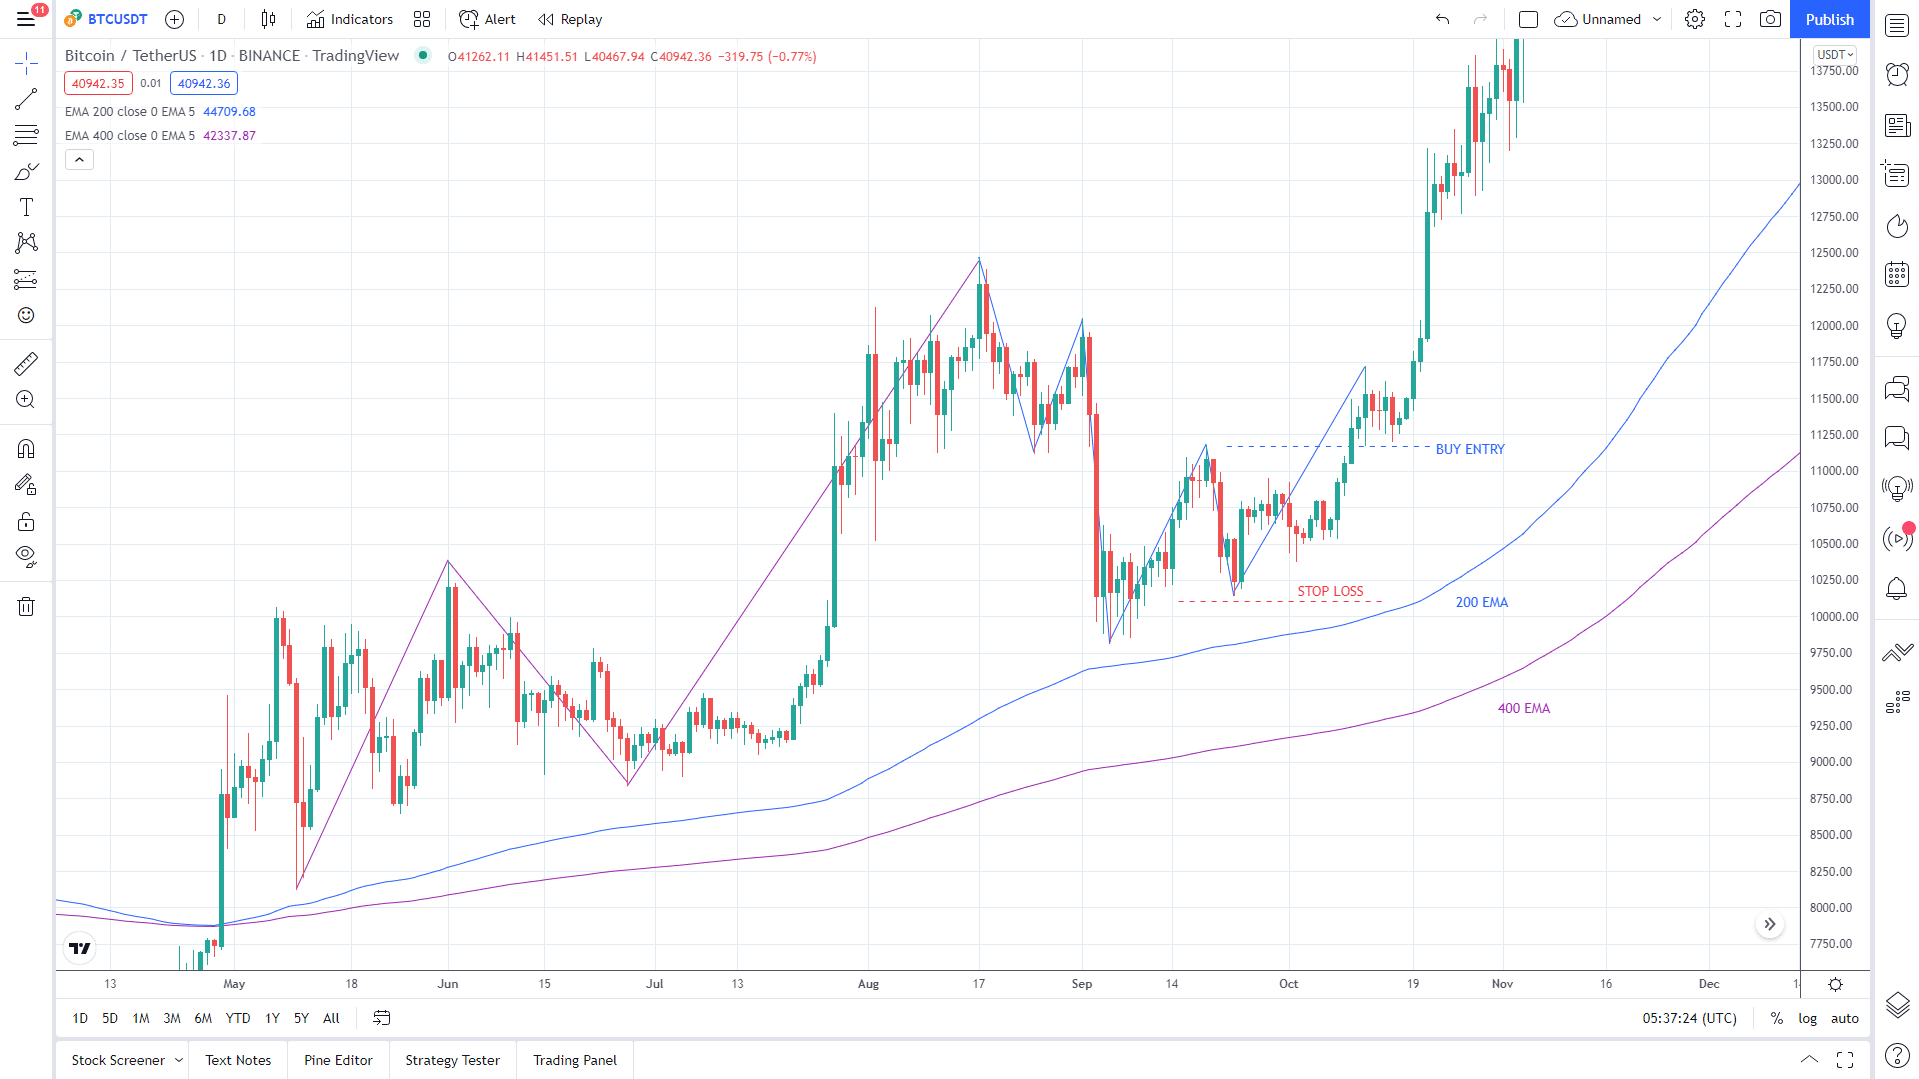
Buy setup on daily Bitcoin chart
Bullish trading conditions
- Best time frames to use: hourly, four-hour, and daily charts.
- Entry: when microstructure aligns with the macrostructure.
- Stop loss: recent swing low.
- Take profit: no specific target, only trailing stop.
There are many ways to trade the trend. This article will look at a simple strategy using a combination of moving averages and market structure. Refer to the above daily Bitcoin chart for a sample buy setup. The trend is bullish since the price is moving above the moving averages. Next, we look at the macro and micro levels of market structure.
- First, we see a step-up ladder formation on the macro-level (purple line).
- Then we see a temporary bearish micro-market structure (blue line).
When the microstructure shifts to a bullish structure, we enter the trade because the two structures are now aligned. We put the stop loss at a recent swing low and let the trade run using a trailing stop.
Bearish trading strategy

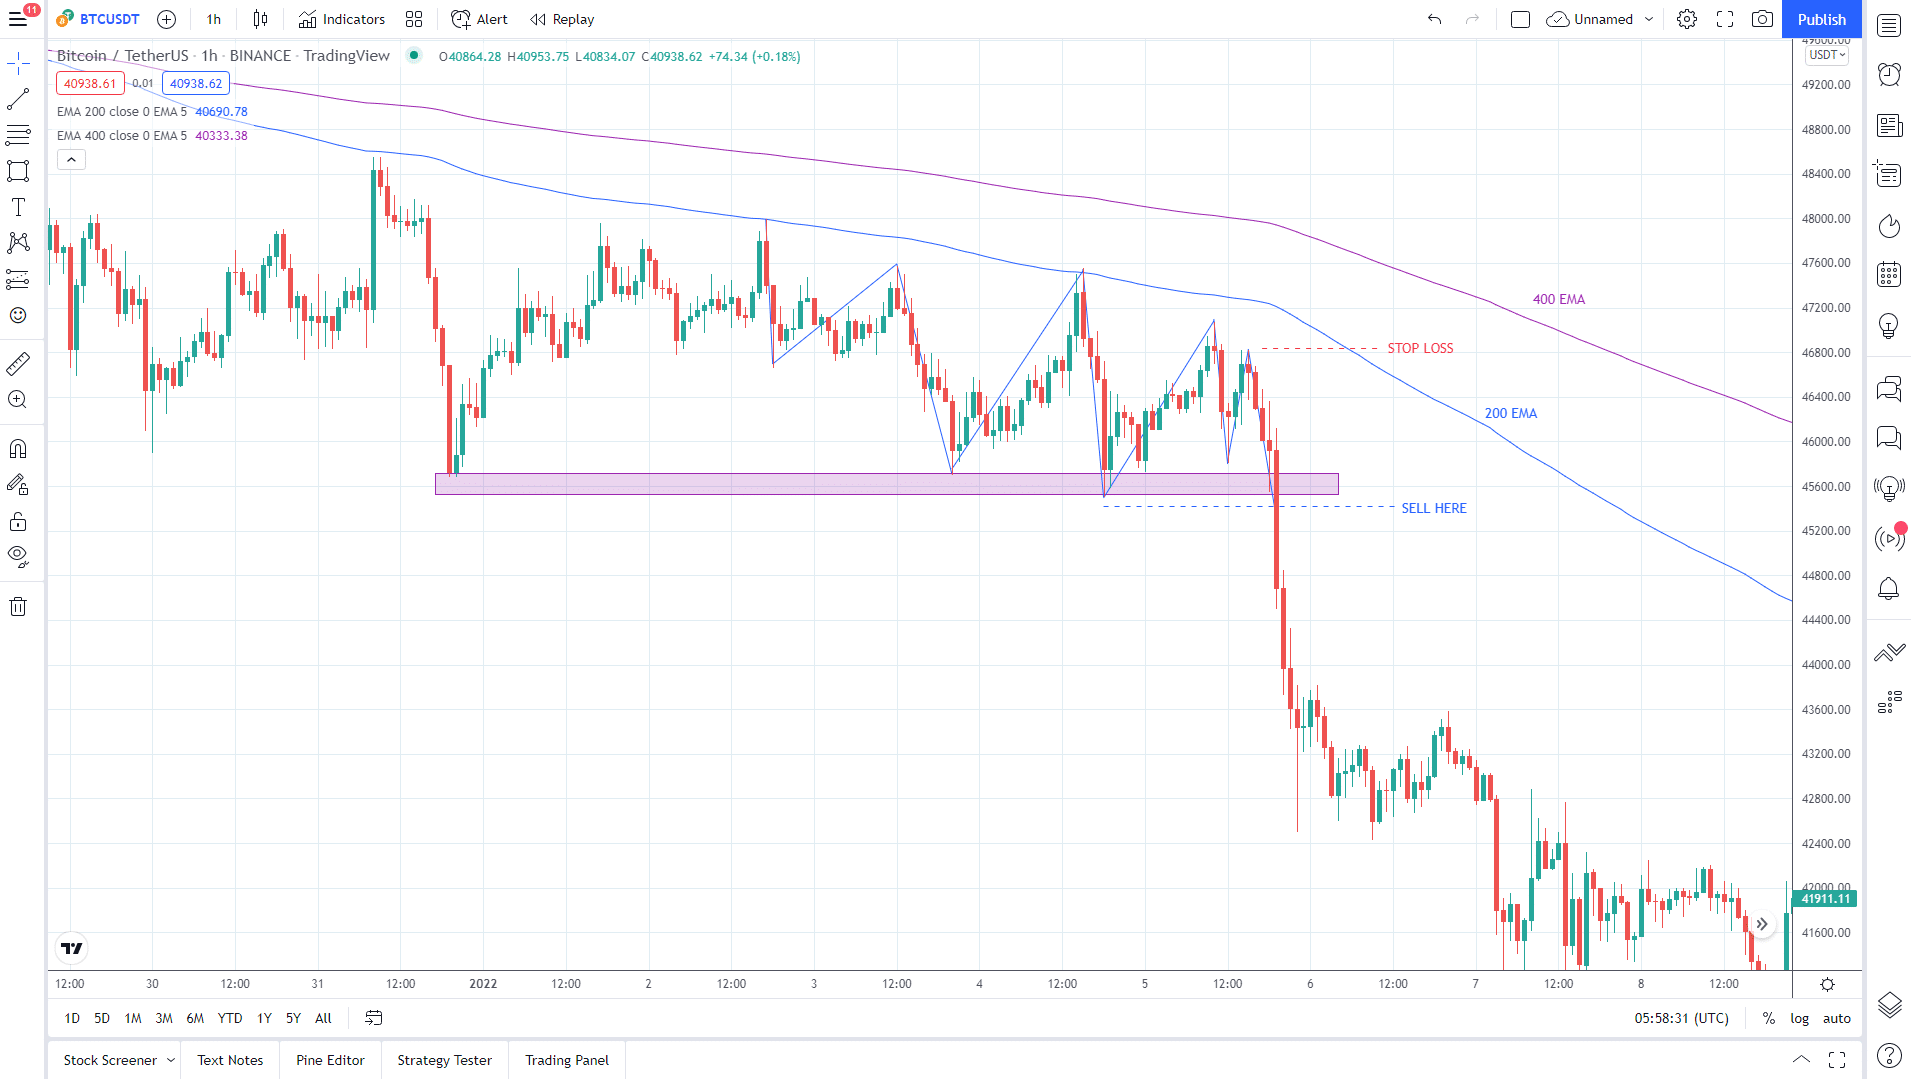
Sell setup on hourly Bitcoin chart
Bearish trading conditions
- Best time frames to use: hourly, four-hour, and daily charts
- Entry: when microstructure aligns with the macrostructure
- Stop loss: recent swing high
- Take profit: no specific target, only trailing stop
In the above chart, Bitcoin is trending down on the hourly chart because the price moves below the two moving averages. Next, we saw that price prints a support area and could not break below it for a while. Then we see a bearish microstructure forming.
Because of the support level in play, we wait for the price to break and trade below support before entering a sell trade. We place the stop loss at a recent swing high. Again, we trail the stop loss to score a possible home run.
Pros and cons of trend trading strategy
Every trading strategy has pros and cons, and a crypto trend trading strategy is no exception. Let us understand its pros and cons in this section.
| Pros | Cons |
|
|
|
|
|
|
Final thoughts
When you start trading crypto using any strategy, learn to pace yourself. Take your time and stick to a specific trading method such as the strategy discussed above. With good analysis, you can control risk to your account. Often entry is not the most important, but exit.
Also, do not allow greediness to motivate your trading. A meager five percent monthly profit is good enough if compounding is in play. Starting with a capital of $1,000, this monthly return could turn $1,000 into $1,800 in one year of trading. Finally, do not feel bad if you lose some trades. Over the long term, your trading edge should play out.


Comments