Looking back in 2021, cryptocurrency has taken the world by storm, with Shiba Inu, for example, seeing a price increase of 43 million percent. Another controversial crypto, Axie Infinity, grew by 12,022 percent in that same year. Further, the popularity of crypto was at a record high in Reddit, recording about 6.6 million mentions of the word crypto within site and getting the greatest number of views in 2021.
Inherent in the crypto market are intense volatility and elevated risk. Primarily fueled by investor sentiment and publicity, crypto investing seems to be governed by fear and greed instead of an objective analysis of fundamental factors. For this reason, the crypto fear and greed index (FGI) came into existence.
This article will learn about this index, how the value is computed, and how you can use it in trading or investing in the crypto market.
What is the crypto fear and greed index?
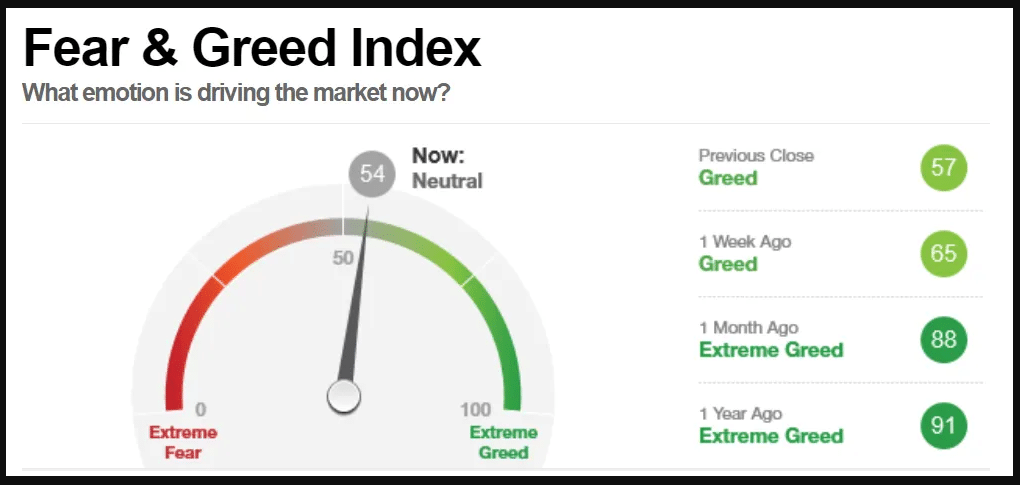
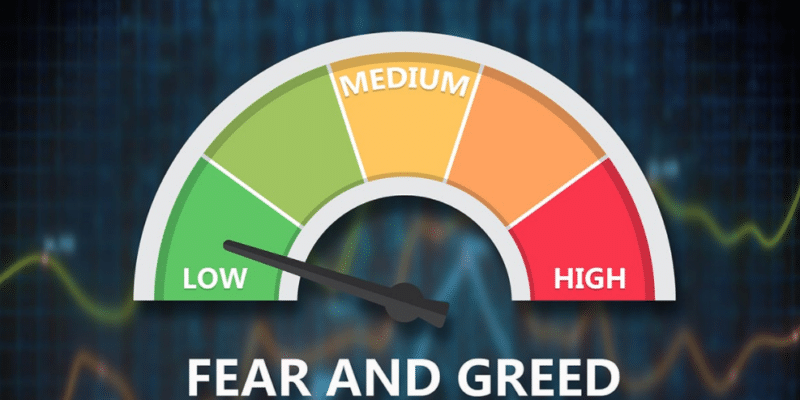
The crypto FGI gives you a hint whether it is a good time to invest in crypto or wait patiently on the sidelines. Typically, the value of the index at any given day reflects the prices of diverse digital currencies, their volatility, and trading volumes. The index indicates the general sentiment of the crypto market. It looks like the image below. Values range from 0 to 100, with 0 suggesting excessive fear and 100 indicating excessive greed.
Said another way, a zero value implies fearfulness, pessimism, and panic among investors, meaning they project a negative outlook of crypto. Counterintuitively, this presents a great buying opportunity. This is similar to the attitude of stock investors when the market goes through a recession.
On the other hand, a 100 value signifies severe optimism about the future outlook of crypto, resulting in greed to buy more. During this time, the market rotates downward, much to the chagrin of crypto investors.

Crypto FGI
Why does fear and greed measurement matter?
Market participants, regardless of the market type, are emotional beings. When the market goes up, investors assume a FOMO attitude and thus become greedy. Meanwhile, investors feel unsafe when their assets are losing value. The FGI helps you perceive the emotional state of investors.
To quickly determine the market sentiment, the index is given in whole numbers from zero to 100. A low value suggests fearsome market participants, which affords brave souls a great buying opportunity. When investors get into a panic buying mode, the index will show a high value, resulting in a market correction.
Components of crypto fear and greed index
The FGI is often presented as a dashboard containing scores reflecting daily market sentiment based on predetermined factors. The algorithm behind this tool scours the internet for information related to these factors, gets a score, and updates the dashboard once a day.
Six factors or variables affect the value of the FGI. These variables are presented and discussed below.
- Volatility (25%)
The maximum drawdown and prevailing volatility of Bitcoin are first measured and then compared with those from the last one month and three months. An extraordinary rise in volatility implies a fearful market.
- Volume and market momentum (25%)
The market momentum and volume are first determined and then compared with those from the last one month and three months. A huge trading volume in a bullish market suggests a greedy market.
- Social media (15%)
At present, social media inputs come from Twitter. The number of posts containing text or hashtags about BTC is counted and the number of interactions. An extraordinarily high interaction rate suggests a growing public interest in Bitcoin. For the index, this represents greed.
- Surveys (15%)
Using polling platforms, weekly crypto polls are conducted to inquire people about how they see the crypto market. Substantial data is from 2,000 to 3,000 votes in each poll.
- Dominance (10%)
The market cap of a coin often defines its placement or rank in a list of crypto assets. Based on the market cap, you can say which crypto is dominant. If the dominance of Bitcoin is fading, it means investors are putting money in riskier altcoins, which suggests a greedy market.
- Trends (10%)
Results of Google Trends for search queries regarding Bitcoin are looked up, trying to understand the change in search volumes and the popularity of related search keywords.

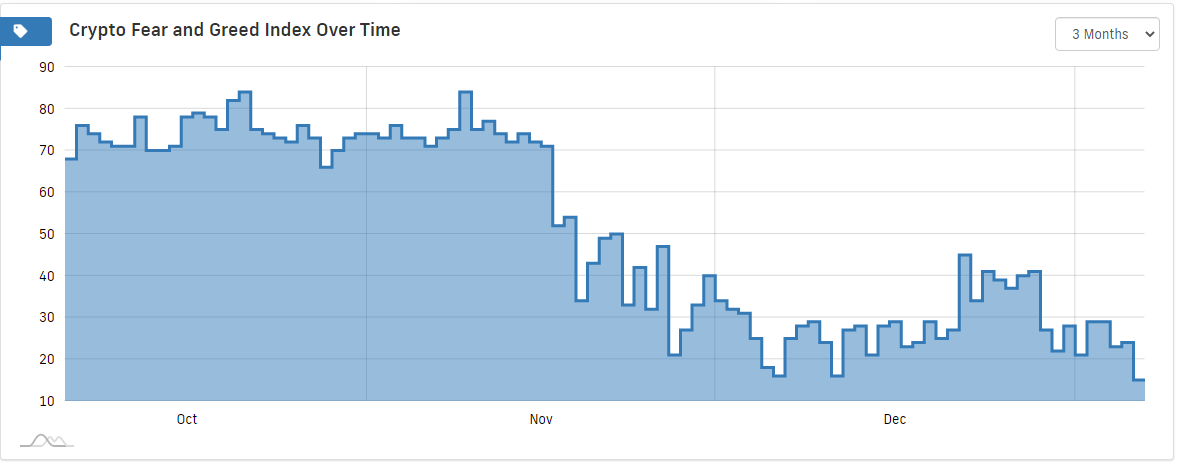
FGI historical data
How to use FGI?
You can use the crypto index as any technical indicator, particularly oscillators. Like the RSI, this index ranges in value from 0 to 100. Then you can use the 50 mark as the neutral level. Any index value above 50 indicates greed, below 50 fear. Once you have the index value, use it with other fundamental and technical tools to arrive at trading or investing decisions.
Are you wondering where you can get this index? You can find the crypto FGI online. Just visit any website that hosts this dashboard. The FGI values look similar everywhere. One good, if not the best, the website is coingecko. It will display two types of index results.
First is a meter that shows the current day’s score. The second is a chart that shows historical values. You can adjust the amount of historical data shown by clicking the drop-down arrow to the upper-right corner of the chart.
Final thoughts
Be aware that the crypto index has limitations, and it is not 100 percent accurate. It primarily portrays the public sentiment toward Bitcoin, with other crypto assets not considered. This index is one of the many technical tools you can use when trading crypto. As a standalone tool, FGI is not sufficient. No one tool is. Use it in conjunction with other tools. No matter what the index says, nothing is better than doing your research and being updated with the latest developments in the crypto space.


Comments