

The ability to interpret crypto charts is one of the most valuable talents an investor can have. If you want to go into trading, you’ll need to learn how to read them.
On the other hand, learning technical analysis and all the jargon that comes with it might be overwhelming for novices. Thus, to improve your trading journey, we’ve produced this guide.
Technical analysis: how can it help in trading?
This analysis studies historical data trends to determine how supply and demand affect a specific asset’s future price movements. Reading crypto market charts can assist investors in making well-informed selections about when positive and bearish moves are expected to conclude. Therefore, reading these charts is vital for traders to identify the best opportunities in the market.
A bullish price movement is one in which the price of an asset soars amid increased demand. Conversely, a bearish movement is when the asset’s sellers, the bears, stomp the price to the downside.
Technical analysis can assist traders in identifying trading opportunities by evaluating price trends and patterns on charts. The finest crypto charts can help you keep track of market changes, but they come with certain limitations.
Learn to read cryptocurrency charts
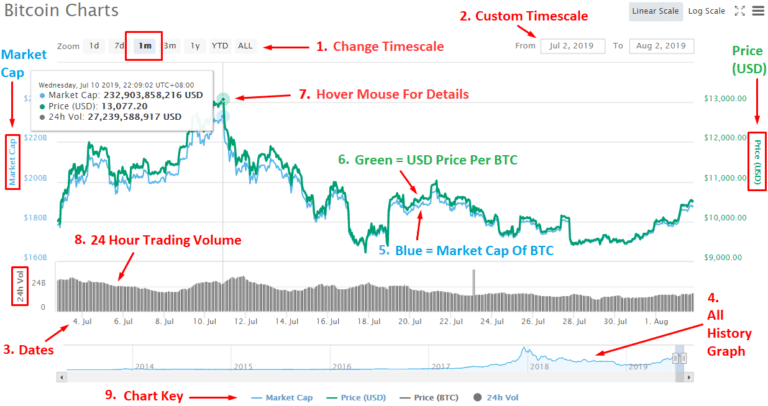
- When it comes to pricing, the market considers everything. All previous, present, and future information has already been included in asset values.
- Multiple aspects, including current, past, future demand, and any regulations that may affect the crypto market, should be considered.
- Price changes aren’t entirely random. They frequently follow trends, which can be long-term or short-term in duration.
- Market experts are more concerned with the price of a coin than with every single variable that influences its price.
Tenets of Dow Theory
Three movements of the market
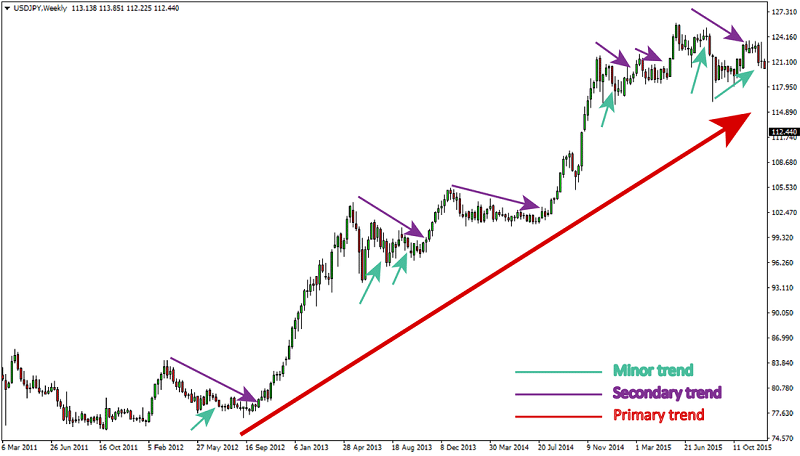
- The primary movement of a market is referred to as the main movement, and it’s a major trend that can last anywhere from a year to several years. The primary trend might be either bullish or bearish.
- The medium swing refers to a market’s secondary or intermediate movement ranging from ten days to three months. The primary price change is used to measure trends in the medium swing.
- The term “short-swing” refers to a market’s minor movement and relates to market speculation that lasts only a few days.
Three phases of market trends
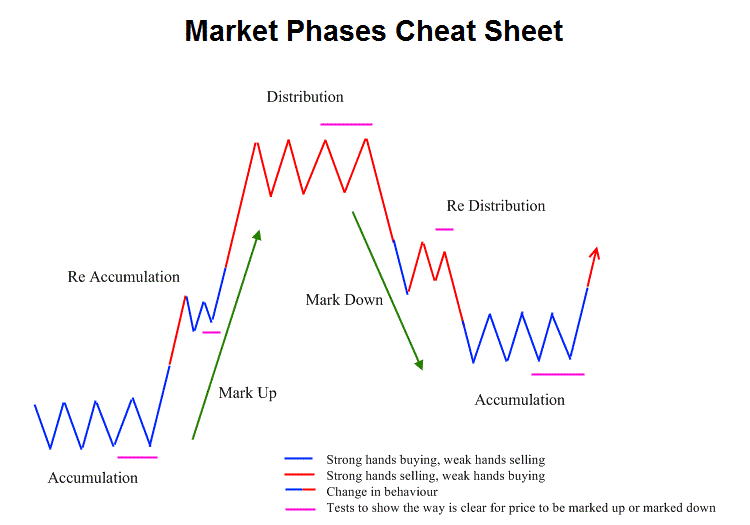
Major market trends are divided into three stages:
-
Accumulation phase
When experienced investors begin buying or selling the coin against the market’s perspective, they are said to be in the accumulation phase.
-
Public participation phase
When the rest of the market begins to follow experienced investors, this is known as the public participation phase, the absorption phase.
-
Distribution phase
After the absorption phase’s speculation, the distribution phase begins. Investors who are well-versed in the market begin to redistribute their assets.
Crypto chart time frames
These charts have different time frames, which provide extra information. Every trader has their style. Therefore, few traders may use 15-minute charts, hourly charts, 4-hour charts, and 1-day charts as options.
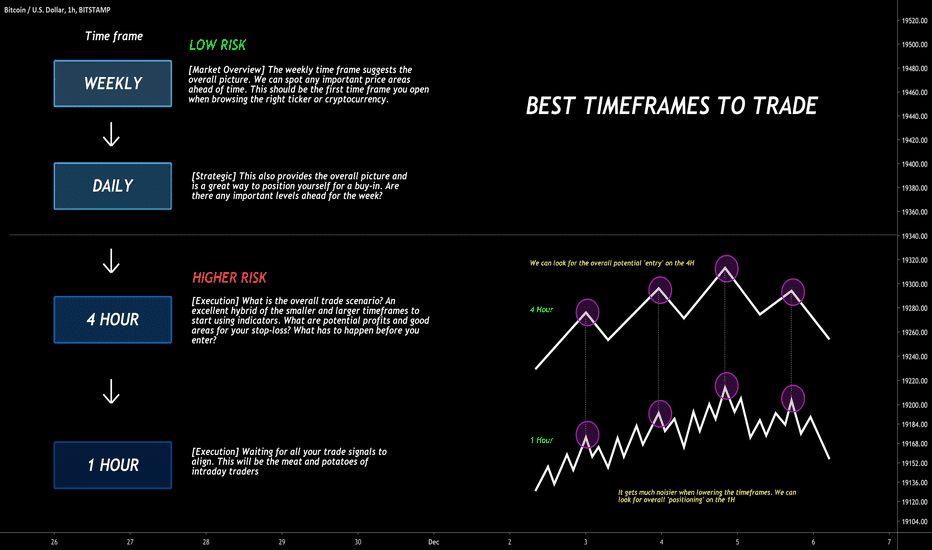
You’d look at the short-period charts if you wanted to open and close your trade in a single day. Long-period charts are what you’d look at if you’re a long-term holder.
Japanese candlestick charts
It is the most popular crypto chart. Each candle represents the asset’s price movement over some time. They have the same logic and are shaped like box-and-whisker charts.
The difference between the asset’s opening and closing prices during the time interval is shown in the box, which is sometimes called the body. The highest price the item obtained during the period is shown by the top whisker, also known as a shadow. In contrast, the bottom whisker shows the lowest price the asset reached throughout the time interval.
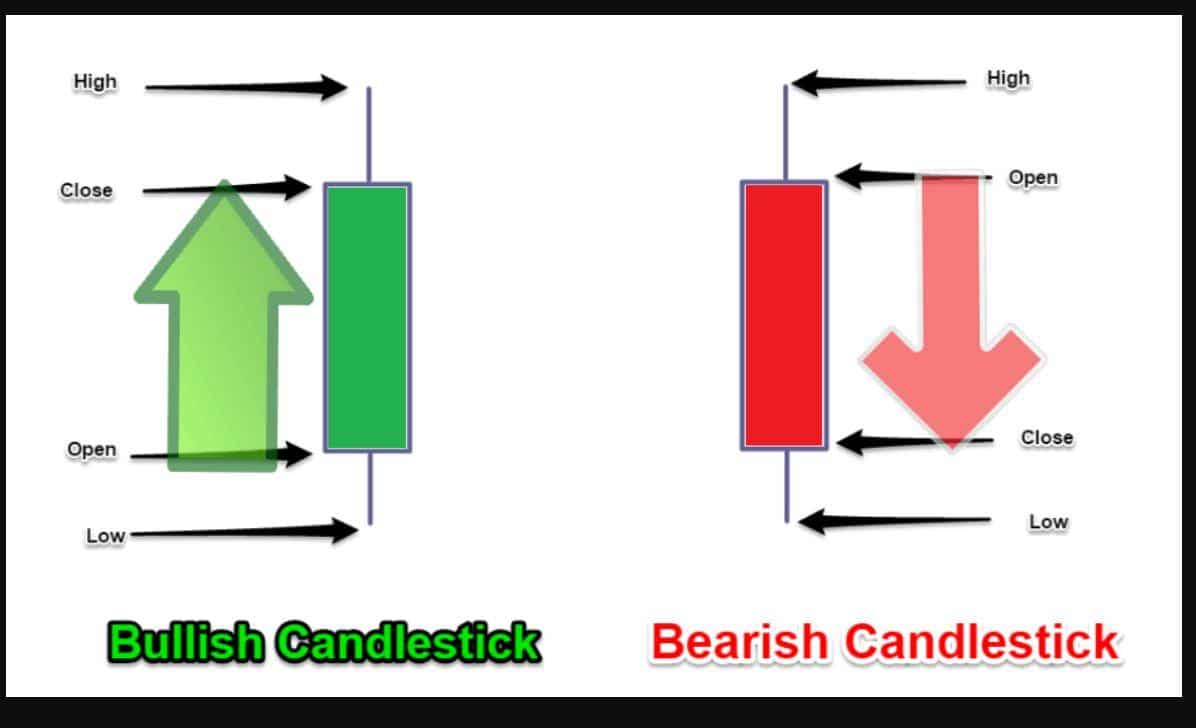
Bullish vs. bearish candlesticks
Candlesticks are divided into two categories: bullish and bearish. Green represents a bullish candlestick.
- A bullish candlestick occurs when the price of a cryptocurrency closes higher than it opened, known as a “bullish candlestick.”
- A bearish candlestick forms when a cryptocurrency closes below the opening price, forming a bearish candle.
Relative Strength Index
RSI is a technical indicator that shows how strong and fast a cryptocurrency’s market price is. It is a comparison of a crypto’s current price to its previous performance.
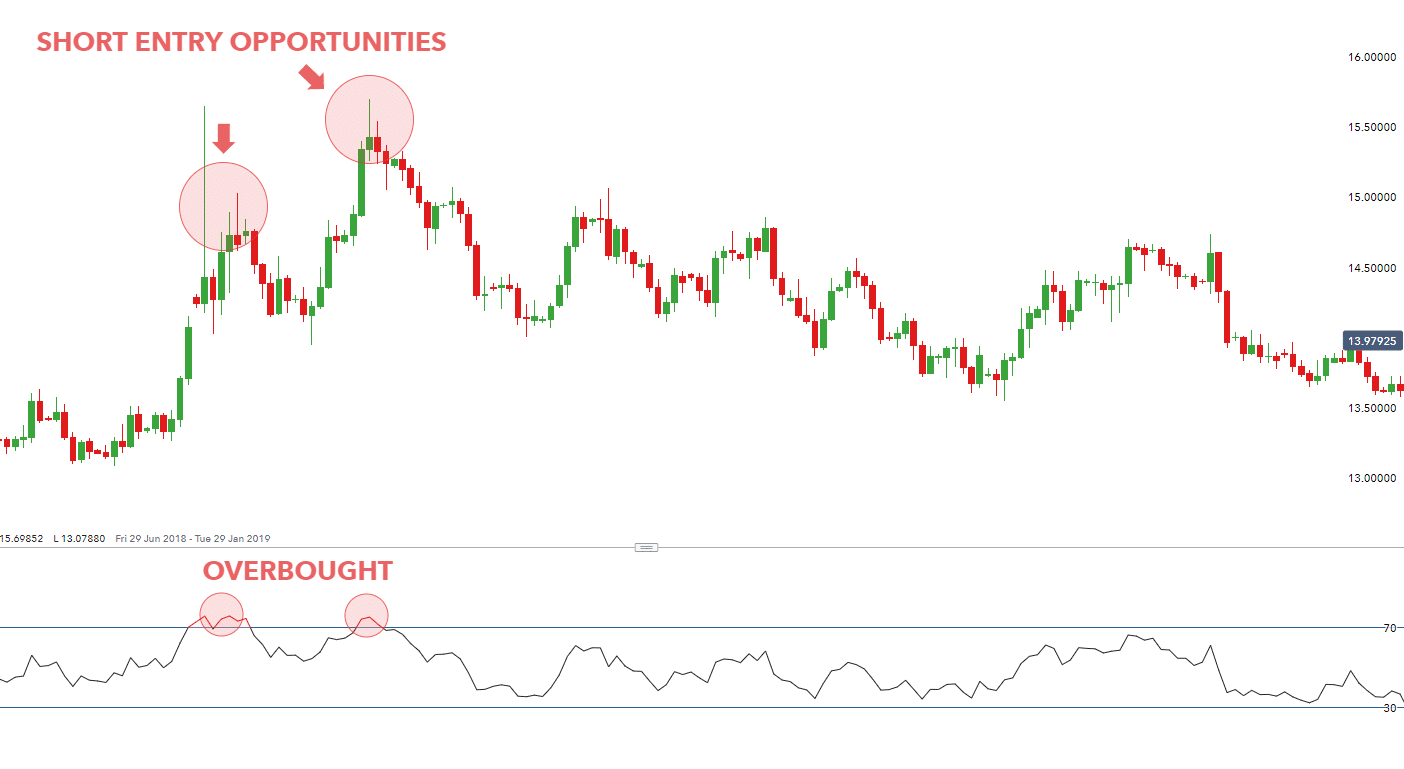
Remember that the RSI varies from 0 to 100 while examining the RSI graph of a particular currency. In general, when a coin’s RSI approaches or crosses 70, it is deemed overbought or overvalued. If the RSI comes 30, on the other hand, the coin is undervalued.
Spotting support and resistance
The assets tend to cease declining once they reach a support level. This is a predefined point at which an asset’s price begins to revert its trend. At the support level, traders frequently buy.
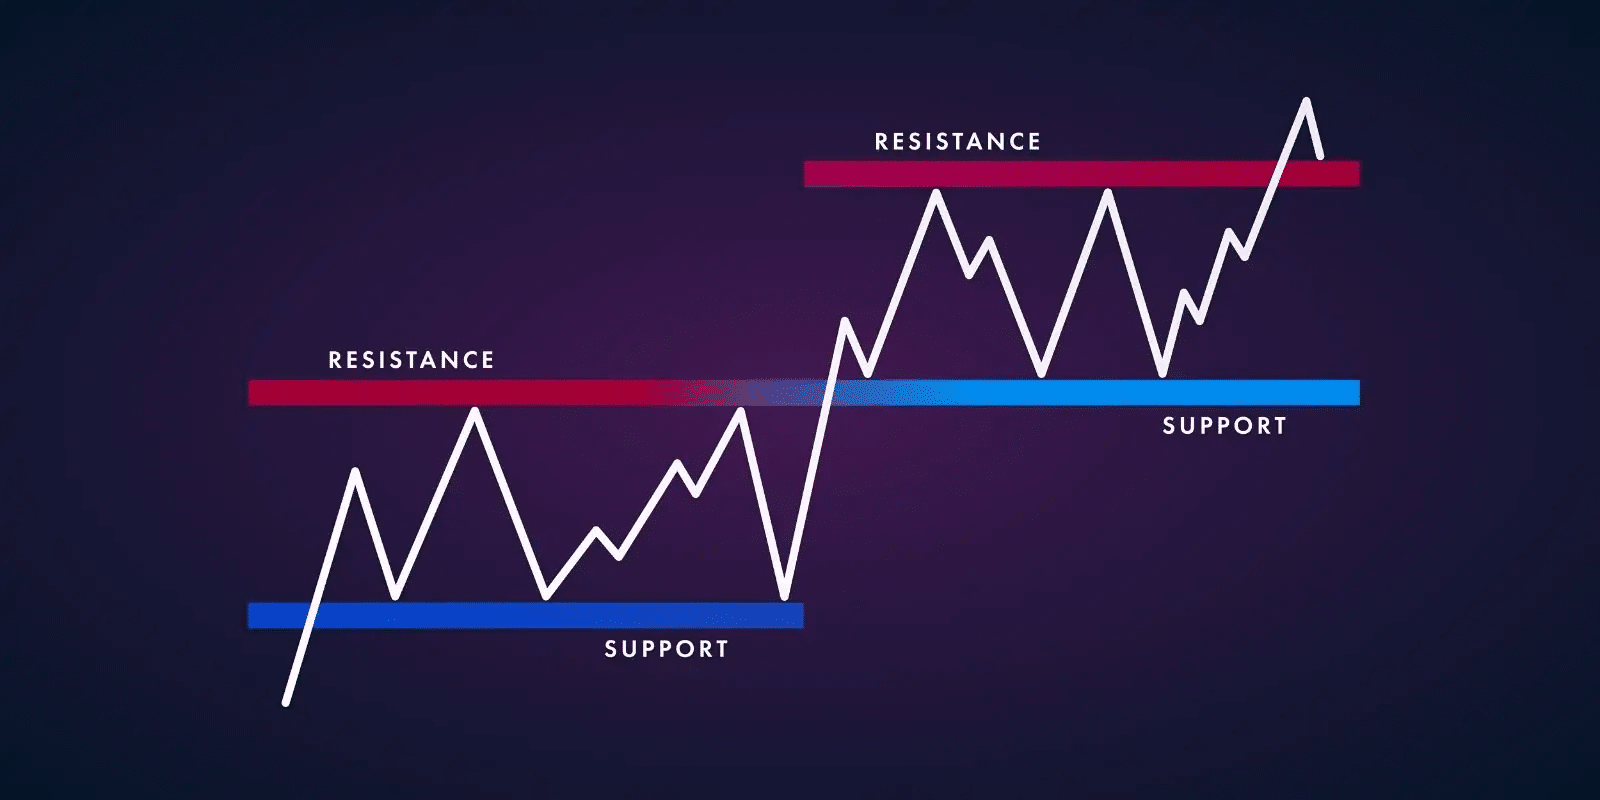
Support and resistance
Likewise, resistance is a predefined point at which the cryptocurrency’s price begins to revert from its bullish trend into a bearish trend. At the resistance level, traders tend to enter sell trades.
Final thoughts
If you want to trade cryptocurrencies, you’ll need to be able to read charts. You must perform effective technical analysis to execute good crypto transactions. Knowing how to interpret crypto charts is the first step towards solid technical analysis.
To establish the support and resistance levels, you must be able to read Japanese candlestick charts. Thus, you will have the best chance of predicting market trends if you can interpret market emotions in this way.


Comments