

The stock market represents one of the most volatile and risky investment segments. Therefore, having a profitable stock portfolio is not just luck but the result of careful consideration and deliberation on various factors.
The emergence of exchange-traded funds has seen stocks take a back seat as an investment instrument due to their ability to reduce risk while ensuring returns.
However, suppose you are new to the investment circles or an old hand and interested in stock investing and the vast potential returns of this market. In that case, William O’Neil, one of the best stock investors of the modern world, has your back.
What is O’Neil’s stock-picking system?
Through a blend of quantitative data, market observation, and intuition, O’Neil turned a $5000 investment into $200.000 over 12 months. He advocates for narrow stock focus and focuses on stock price action with data-driven decisions free of emotions. This approach evolved to blend technical and fundamental analysis:
- Fundamental analysis for picking the right stocks.
- Technical analysis for picking the ideal time to get into the identified stocks.
The refinement of O’Neil’s stock-picking system is now known as the CAN SLIM investing system after the indicators analyzed:
- Current Quarterly Earnings
- Annual earnings
- P/E ratio
- Revenue
- Growing market
- Supply & demand
- Leader or laggard
- EBITDA
- Performance
Here, we take a look at these indicators and how to utilize them for stock picking. But first, let’s choose three companies in three different sectors for comparison.
1. Anheuser-Busch InBev SA/NV (BUD)
A company in the consumer defensive sector.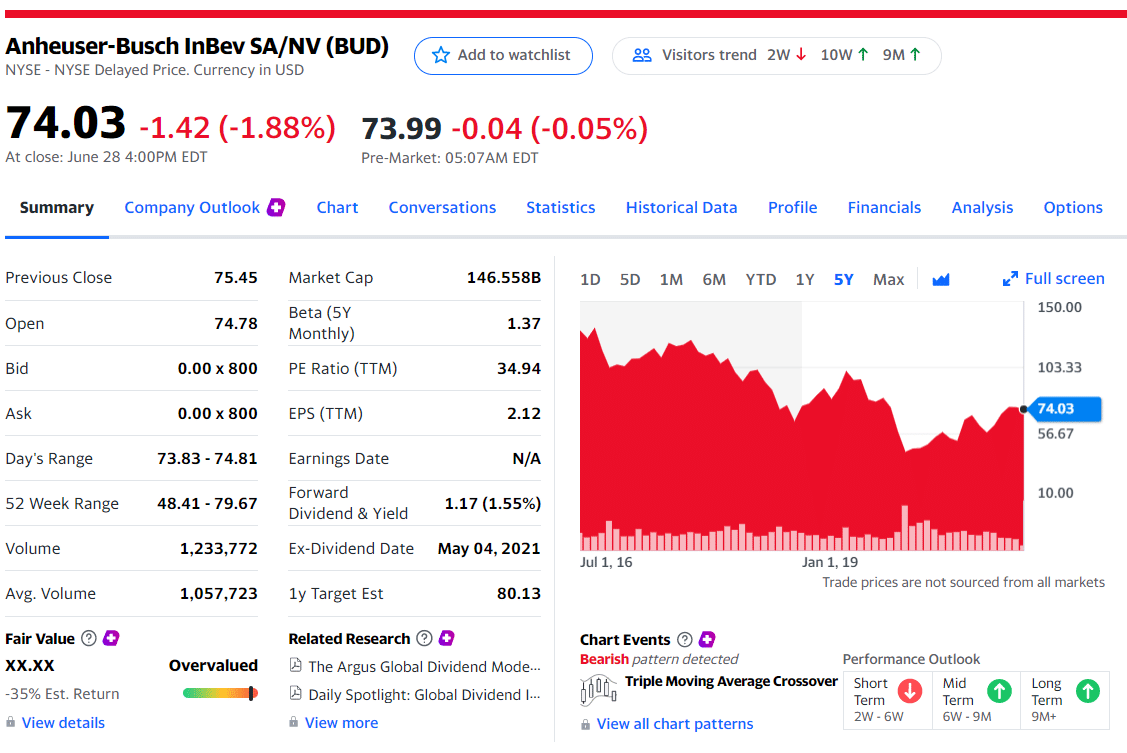
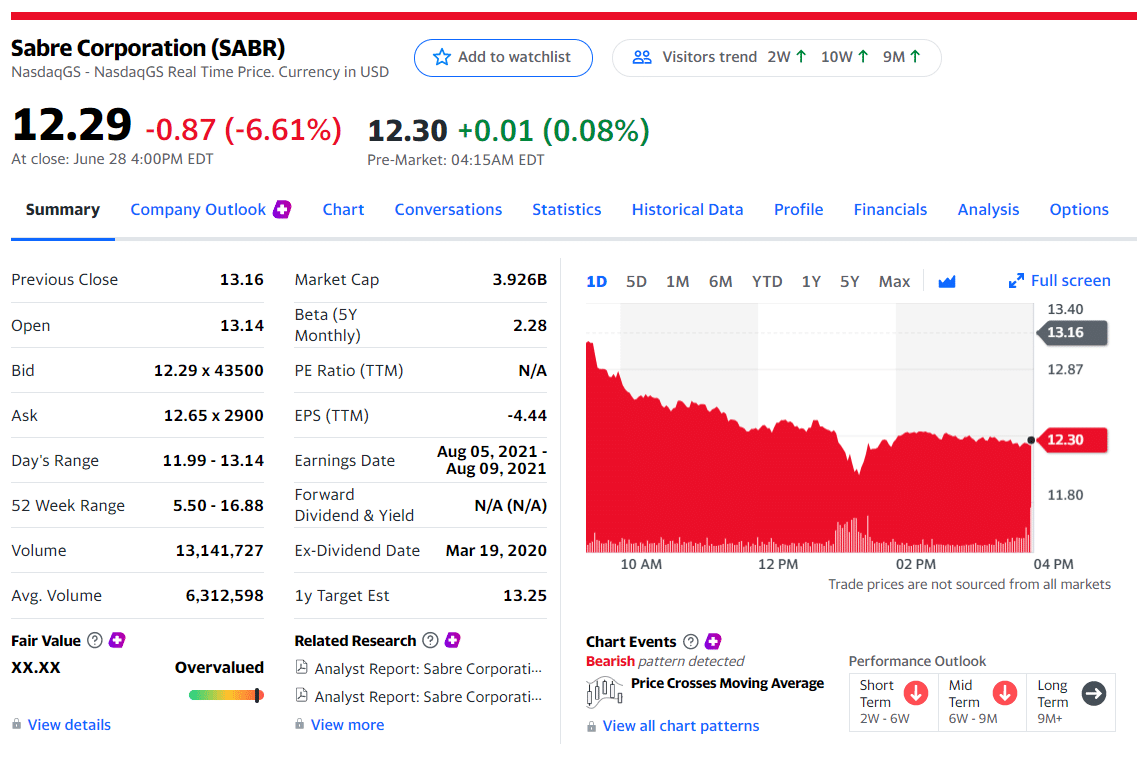
2. Sabre Corporation (SABR)
A company in the technology sector.
3. Prestige Consumer Healthcare Inc. (PBH)
A company in the healthcare sector. 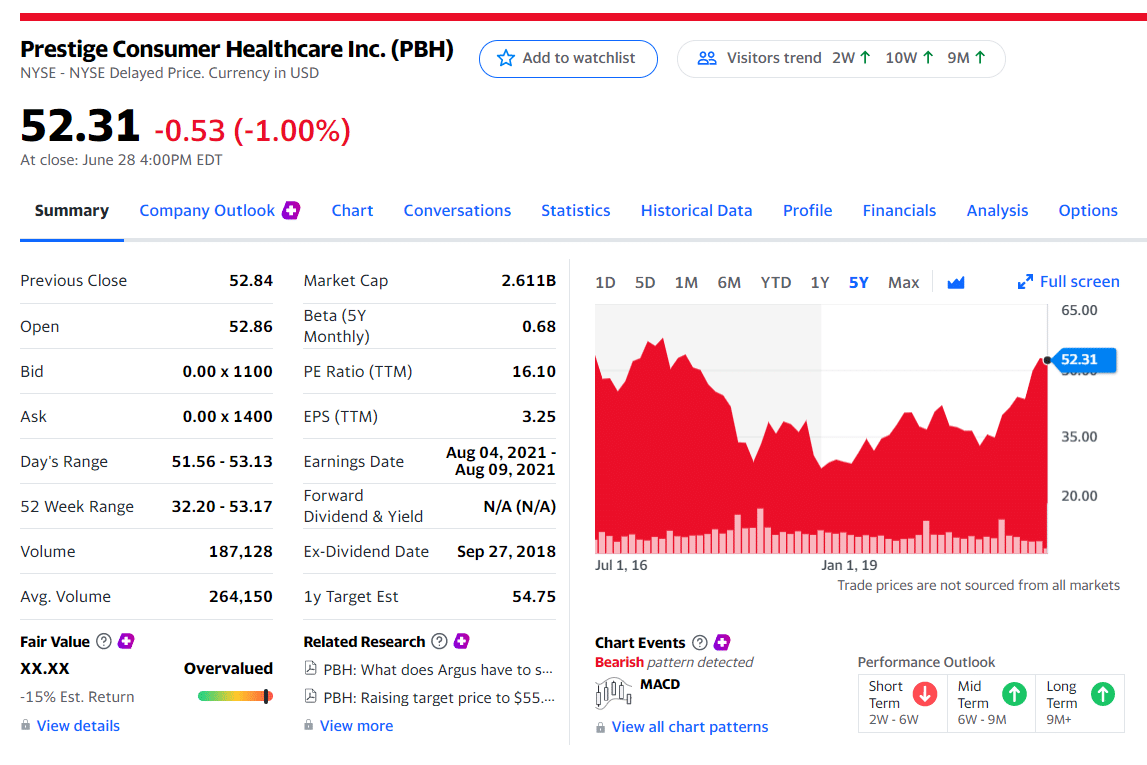
Let’s take a look at the nine leading indicators.
№ 1. Quarterly EPS
The first indicator to look at is quarterly earnings per share, EPS. William advocates for an EPS of 15% and above, analyzed quarter-on-quarter. This indicator pits corporate profits against the outstanding shares. EPS value is an indicator for the market worth of stock; the higher the EPS, the better.
| Company | Ticker | 2020 Q2 EPS | 2021 forecasted Q2 EPS | Growth |
| Anheuser Busch InBev | BUD | 0.79 | 0.96 | 22% |
| Sabre Corp. | SABR | -0.87 | -0.49 | 44% |
| Prestige Consumer Healthcare Inc. | PBH | 0.72 | 0.88 | 22% |
The three companies above all have a projected EPS growth of more than 20%, making the perfect growth stocks for investment.
№ 2. Annual EPS
Building on the quarterly earnings per share metrics, the second indicator for consideration is the annual earnings per share. The reason for analyzing both short-term and long-term EPS is to ensure that the organization grows in the short term and is a going concern for the foreseeable future.
O’Neil advocates for looking at an organization’s three-year and five-year earnings, with the ideal growth being 25% and above.
| Company | Ticker | EPS past five years | Forecasted EPS next five years | Growth |
| Anheuser Busch InBev | BUD | -15.6% | 2% | 113% |
| Sabre Corp. | SABR | 4.43% | -32.33 | -830% |
| Prestige Consumer Healthcare Inc. | PBH | 0.72 | 0.88 | 22% |
Of the three stocks above for consideration, Sabre Corp. equities lose out because the projected growth of EPS over the next five years is -830%. The stock to invest in given the annual EPS would be BUD, projected five-year growth is 113%, way above the minimum requirement of 25%.
№ 3. P/E ratio
Does the EPS correspond to the market value? The price earning ratio measures the growth of equities against the overall market growth. As the EPS is specific to an organization, the P/E ratio pits stocks in the same industry against each other to ensure an investor has the big industry picture.
| Company | Ticker | PE ratio |
| Anheuser Busch InBev | BUD | 16.1% |
| Sabre Corp. | SABR | 16.1% |
| Prestige Consumer Healthcare Inc. | PBH | 16.1% |
The average P/E ratio across the S&P 500 spectrum is in the 13-15 range. Given that the S&P 500 represents the best performing organizations across the US economy, investing in an organization with a P/E above this range is desirable, especially for emerging markets.
№ 4. Revenue
Every investor aims to hold stocks and sell them at a higher value, and as a bonus, earn an income in the form of dividends. Consequently, companies that can fulfill both of these investment objectives are the most sort after in the market.
A clear indication of an organization that results in the achievement of these objectives is revenue growth. An investor pits the gross profit against the total revenues; an increase in this percentage shows an organizational revenue.
| Company | Ticker | 2019 revenue analysis | 2020 revenue analysis | Growth |
| Anheuser Busch InBev | BUD | 61% | 52% | -9% |
| Sabre Corp. | SABR | 24% | -30% | -54% |
| Prestige Consumer Healthcare Inc. | PBH | 1.5% | 0% | 1.5% |
Using the table above as an example, keeping in mind the pandemic in 2020 and its disruption on economic activities, only Prestige Consumer Health Inc. had positive growth. On this particular indicator, PBH carries the day.
№ 5. Growing market
It is always advisable to go for stocks in markets that show more than average potential for growth. An analysis of the potential market averages of the stocks under review gives insight into the market’s direction, advising on the positions to take for profitability. In addition, investors look to segment indexes to determine whether the overall stock market is goring or in decline.
| Company | Ticker | Market index | Three-year returns |
| Anheuser Busch Inbev | BUD | XLP | +15.76% |
| Sabre Corp. | SABR | XLV | +27.22% |
| Prestige Consumer Healthcare Inc. | PBH | XLK | +16.62% |
Using the three stocks above for analysis, Sabre Corp. represents the best investment options. It is no surprise that it is a tech company; the technology sector currently runs the world.
№ 6. Supply/demand
To a large extent, the supply and demand forces guide the stock market movements. The same forces are attributable to stock market downturns and upturns. As an investor, you have to analyze stocks and identify their intrinsic value: it helps identify undervalued stocks and overvalued stocks.
Pro tip: buy stocks that exhibit a firm’s share buyback. Repurchase results in diminished equity market supply, hence strategic positioning for a price increase. It also shows insider confidence in such a stock.
№ 7. Leader, not laggard
Using the relative strength index indicator, identify the position of the stocks relative to the industry participants. Oversold stocks, RSI readings of less than 30 exhibit market undervaluation, presenting bullish opportunities. On the other hand, overbought stocks, RSI readings of more than 70, exhibit market overvaluation offering exit opportunities for bullish positions.
For instant income, go for stocks displaying current market valuation, between RSI readings of 30 and 70.
№ 8. EBITDA and debt / EBITDA
One of the main indicators for choosing companies for value investing.
- The EBITDA multiplier stands for the ratio of the company’s value (enterprise value) to earnings before interest, taxes, depreciation & amortization, EBITDA. It makes it possible to estimate for how many years the profit brought by the company will recoup the cost of its acquisition, taking into account debt obligations. This considers the so-called fair profit, that is, the amount not yet cleared of depreciation and loan servicing costs.
Using this ratio makes it possible to compare issuers with different levels of debt burden. One of the main advantages of the multiplier is the ability to compare the results of foreign companies correctly. It avoids the error caused by differences in the taxation system of different countries. It is essential to take EBITDA into account when evaluating capital-intensive industries that spend significant amounts on renovating fixed assets.
- Debt / EBITDA shows how many years it takes to pay off existing debts at a constant profit level. The higher this indicator, the higher the risk of potential bankruptcy. Experienced investors use this multiplier when analyzing the history of the issuer’s debt burden and forecasting its development dynamics.
№ 9. Performance
The first step to picking stocks is looking at the potential returns since the objective of the investment is additional income and financial freedom. The best way is to screen stocks on an industry basis and make informed decisions like stocks; otherwise, it becomes subjective. Always analyze the three and five-year returns to have a broad outlook of the resilience of equities over the long haul.
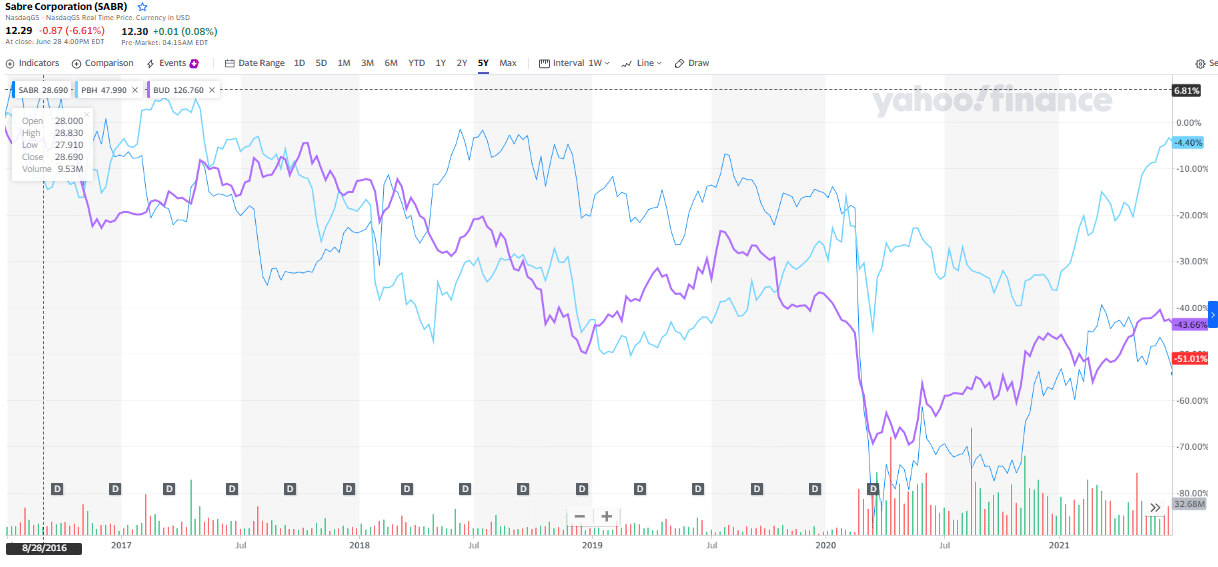
The comparative five-year chart above shows that for the companies under consideration, Anheuser Busch Inbev, Sabre Corp., and Prestige Consumer Healthcare Inc., PBH, the go-to equity, performance-based.
Final thoughts
Using these nine factors as a basis for making stock investment decisions eliminates emotions from decision making, ensuring that stocks picked have the most significant potential for growth and returns.
For the three stocks in use for writing this guide, Prestige Consumer Healthcare Inc. is the stock to invest in; it ticks all the right boxes for all the nine indicators. Personal investment objectives and risk tolerance levels guide how much weight to assign to each indicator.


Comments